The following information is provided on waste reduction and recycling from the Council kerbside collection service.
Note that all measurements are by weight, not volume.
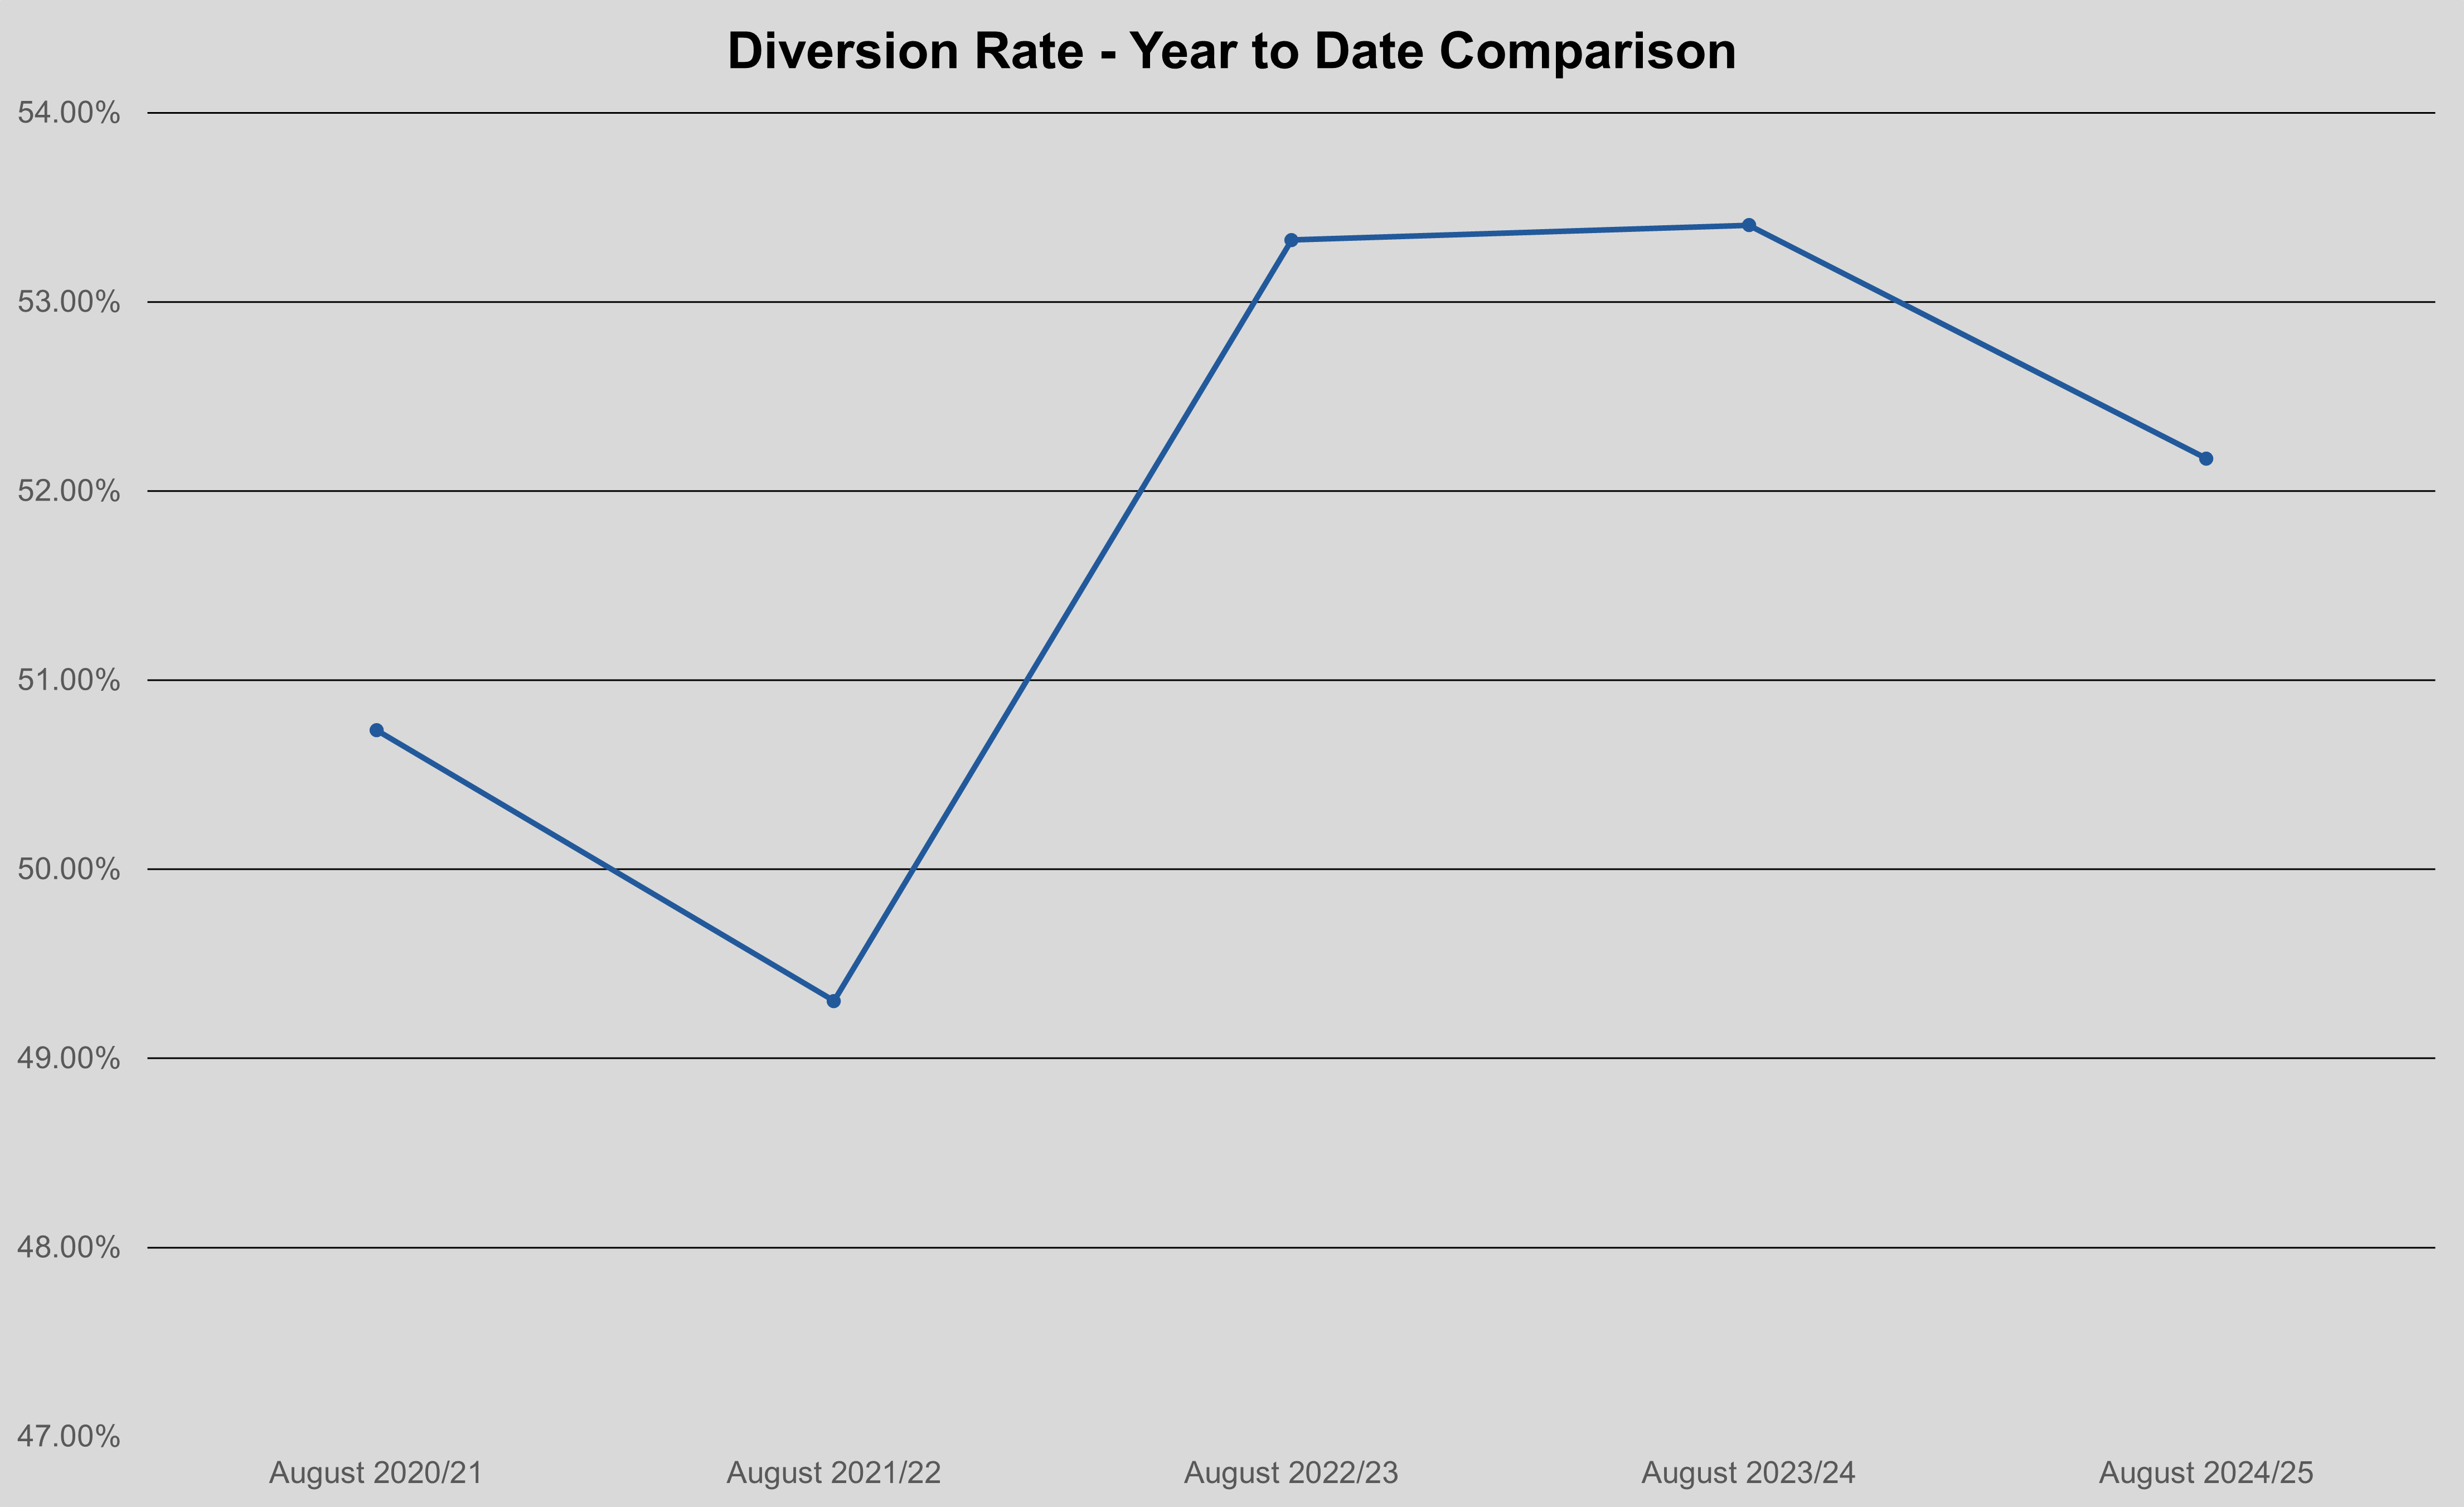
2024/25 Summary
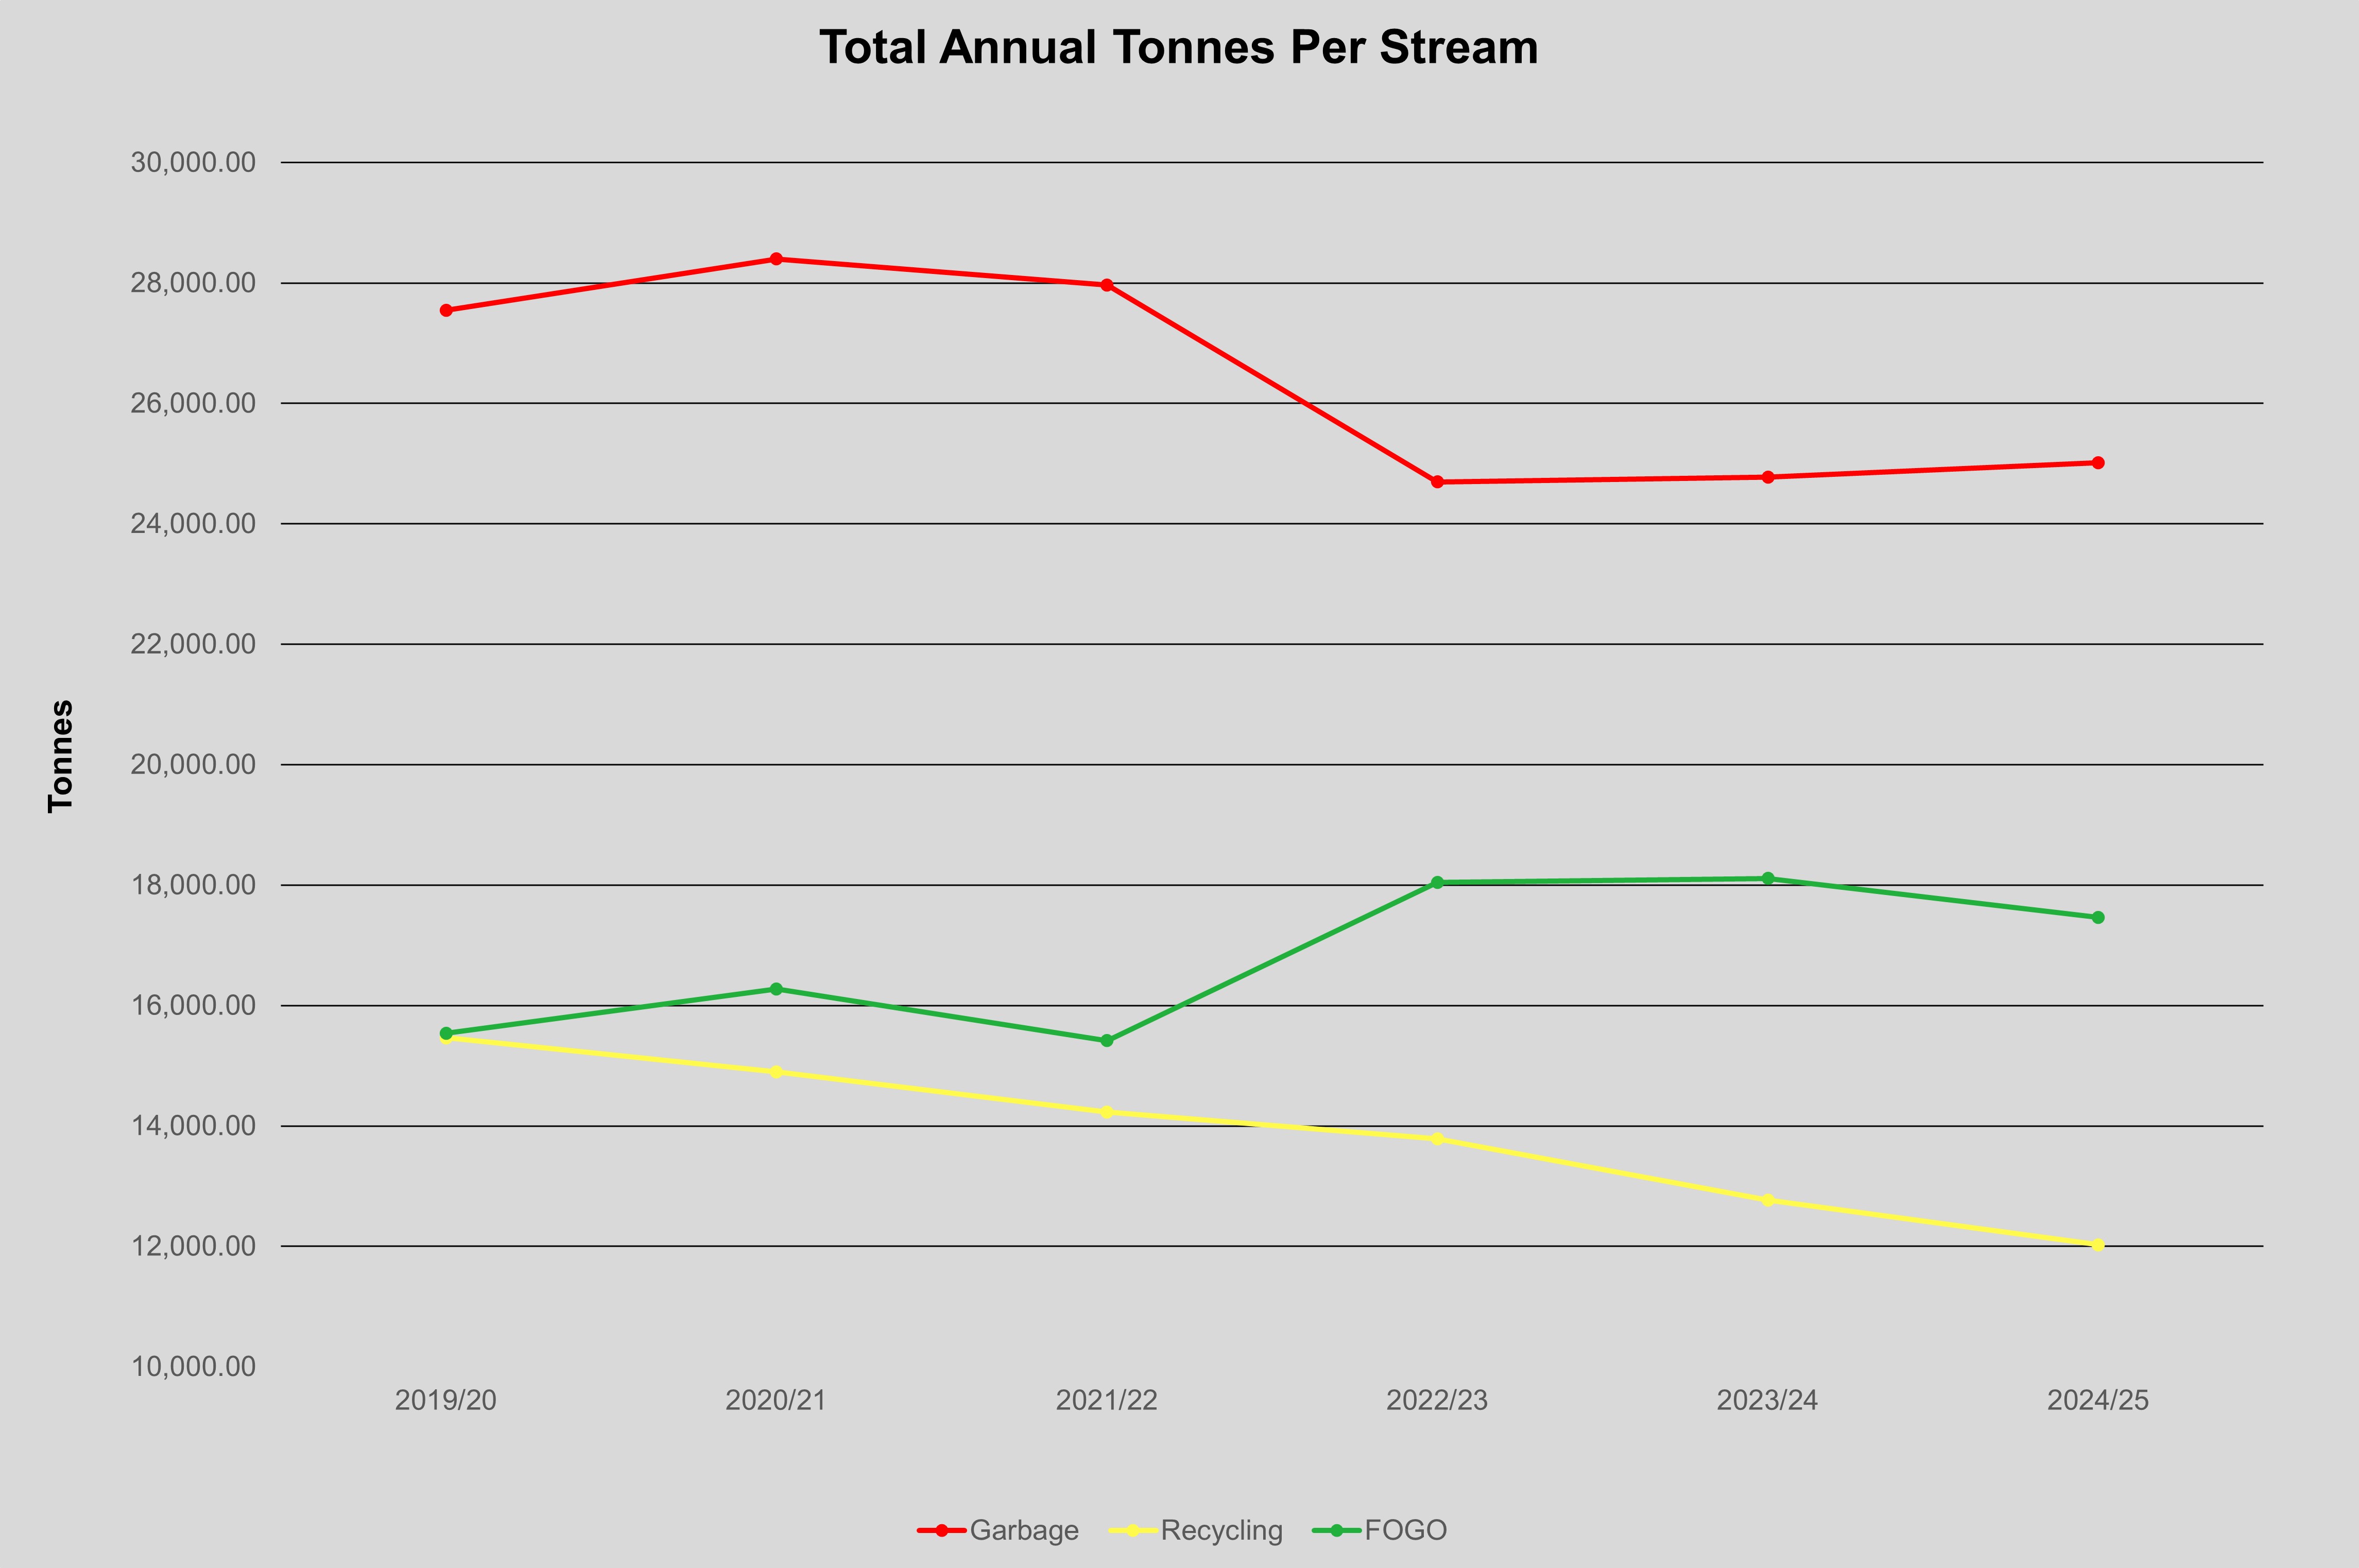
In 2024/25 the overall amount of waste that was diverted away from landfill was 54%. This is slightly lower than the previous year. The continuation of the Victorian Governments Container Deposit Scheme as well as lighter materials used in packaging is slowly reducing the weight of co-mingled recycling materials being collected. The diversion rate remains consistently higher than before the introduction of the food organics and garden organics (FOGO) service. More food waste slowly continues to be removed from garbage bins and collected in the FOGO bins which is processed for compost and mulch.
In comparison to previous years:
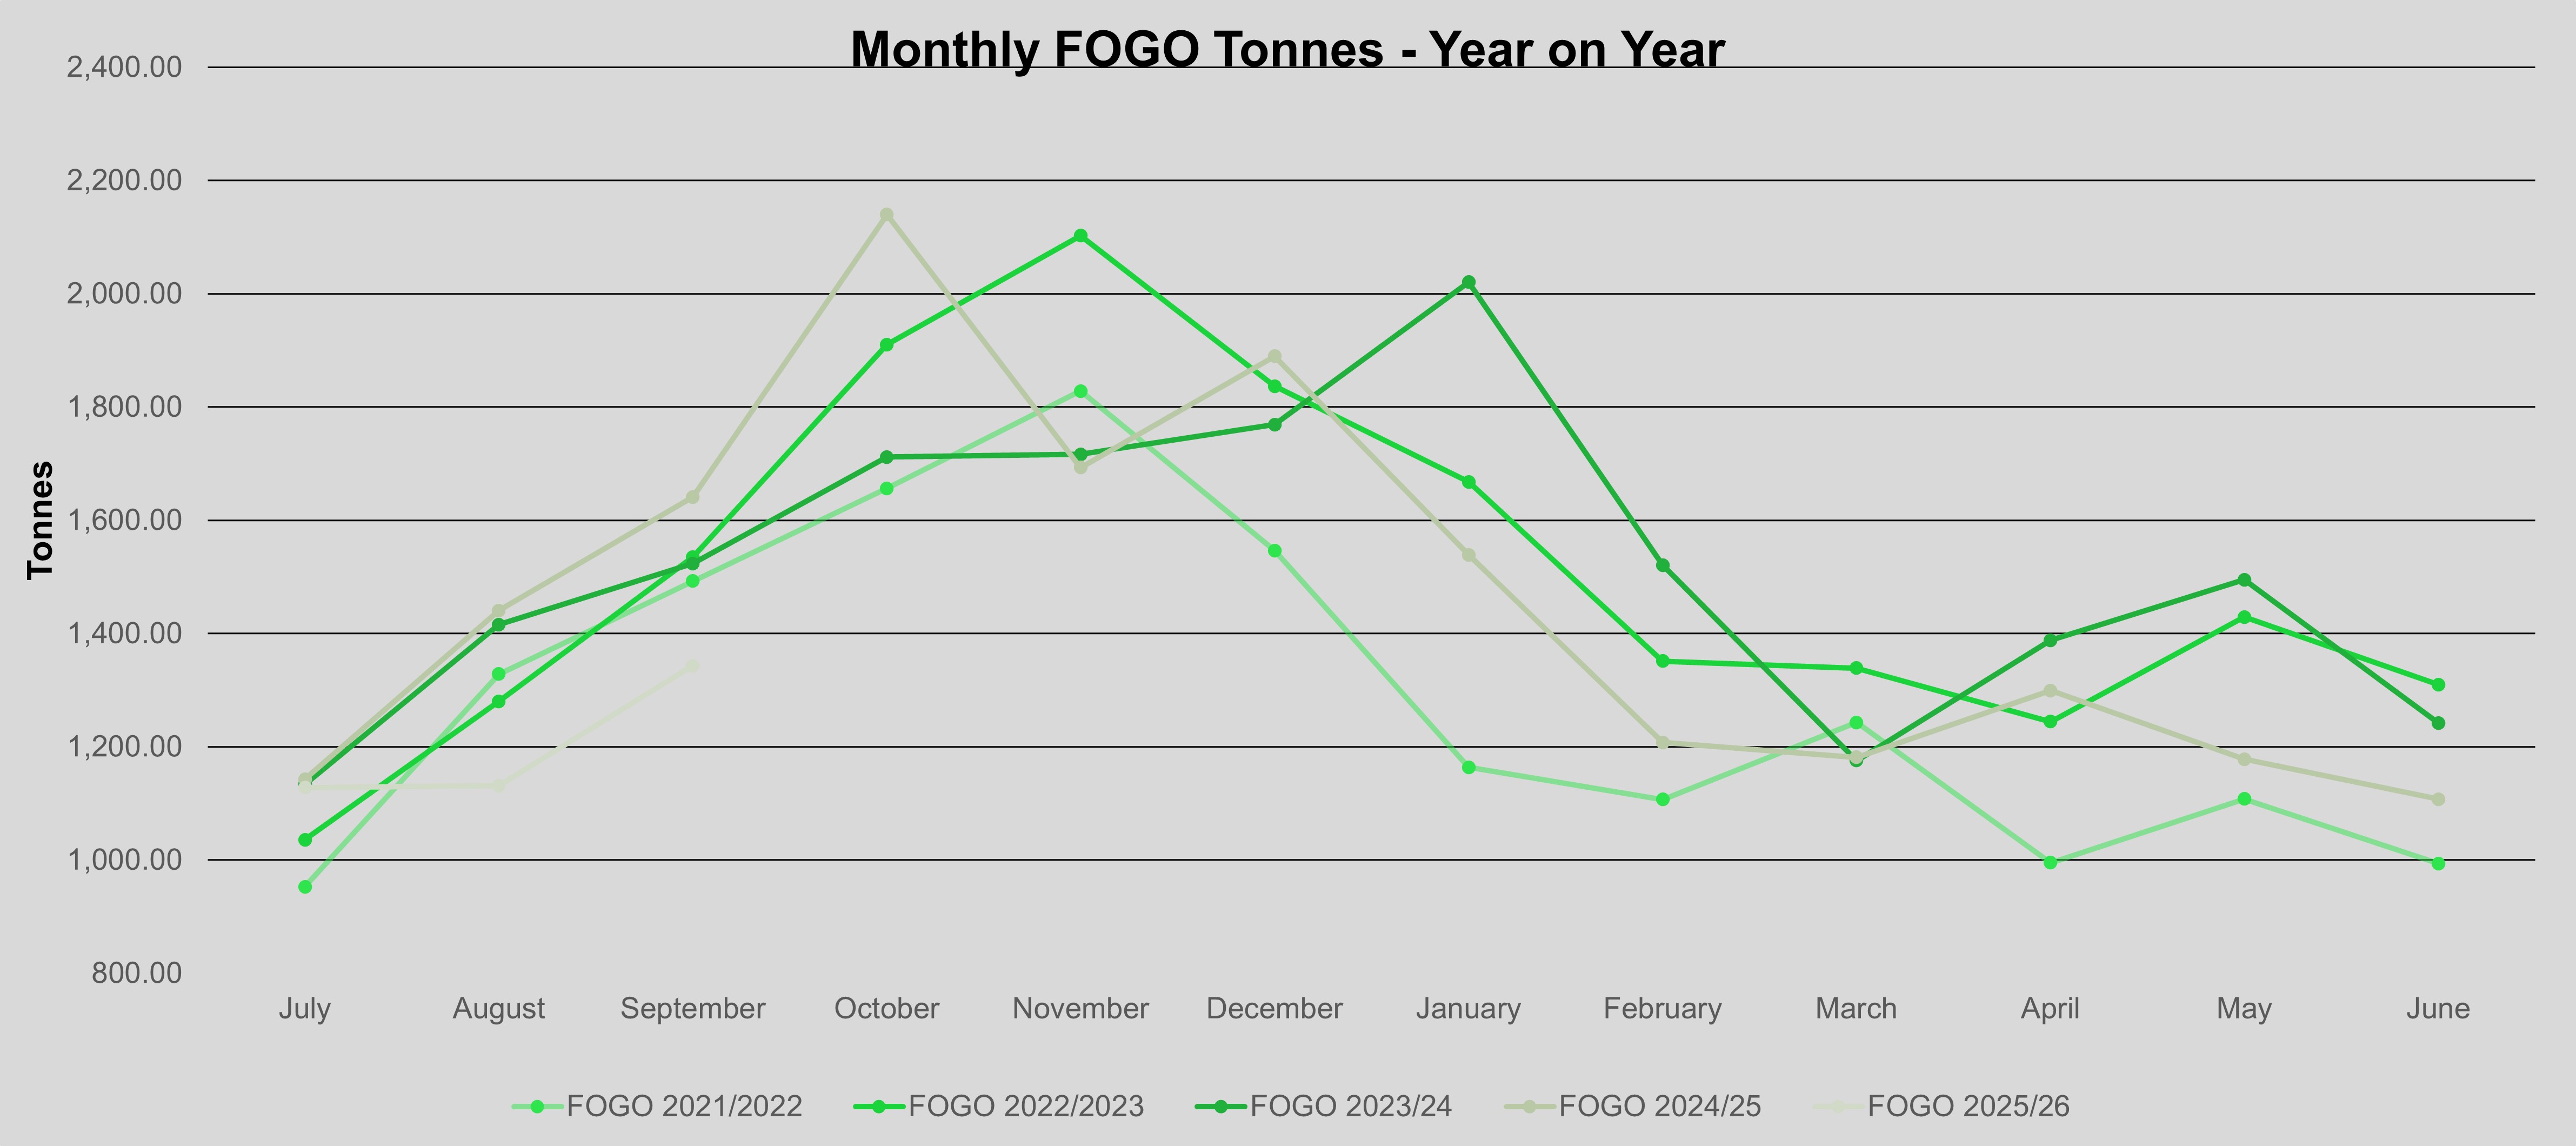
- The amount of FOGO material continues to be consistent with previous season trends, with a spike in the spring season in 2024/25 it was a slightly drier spring compared to previous year so less organic growth and materials collected than the year previous.
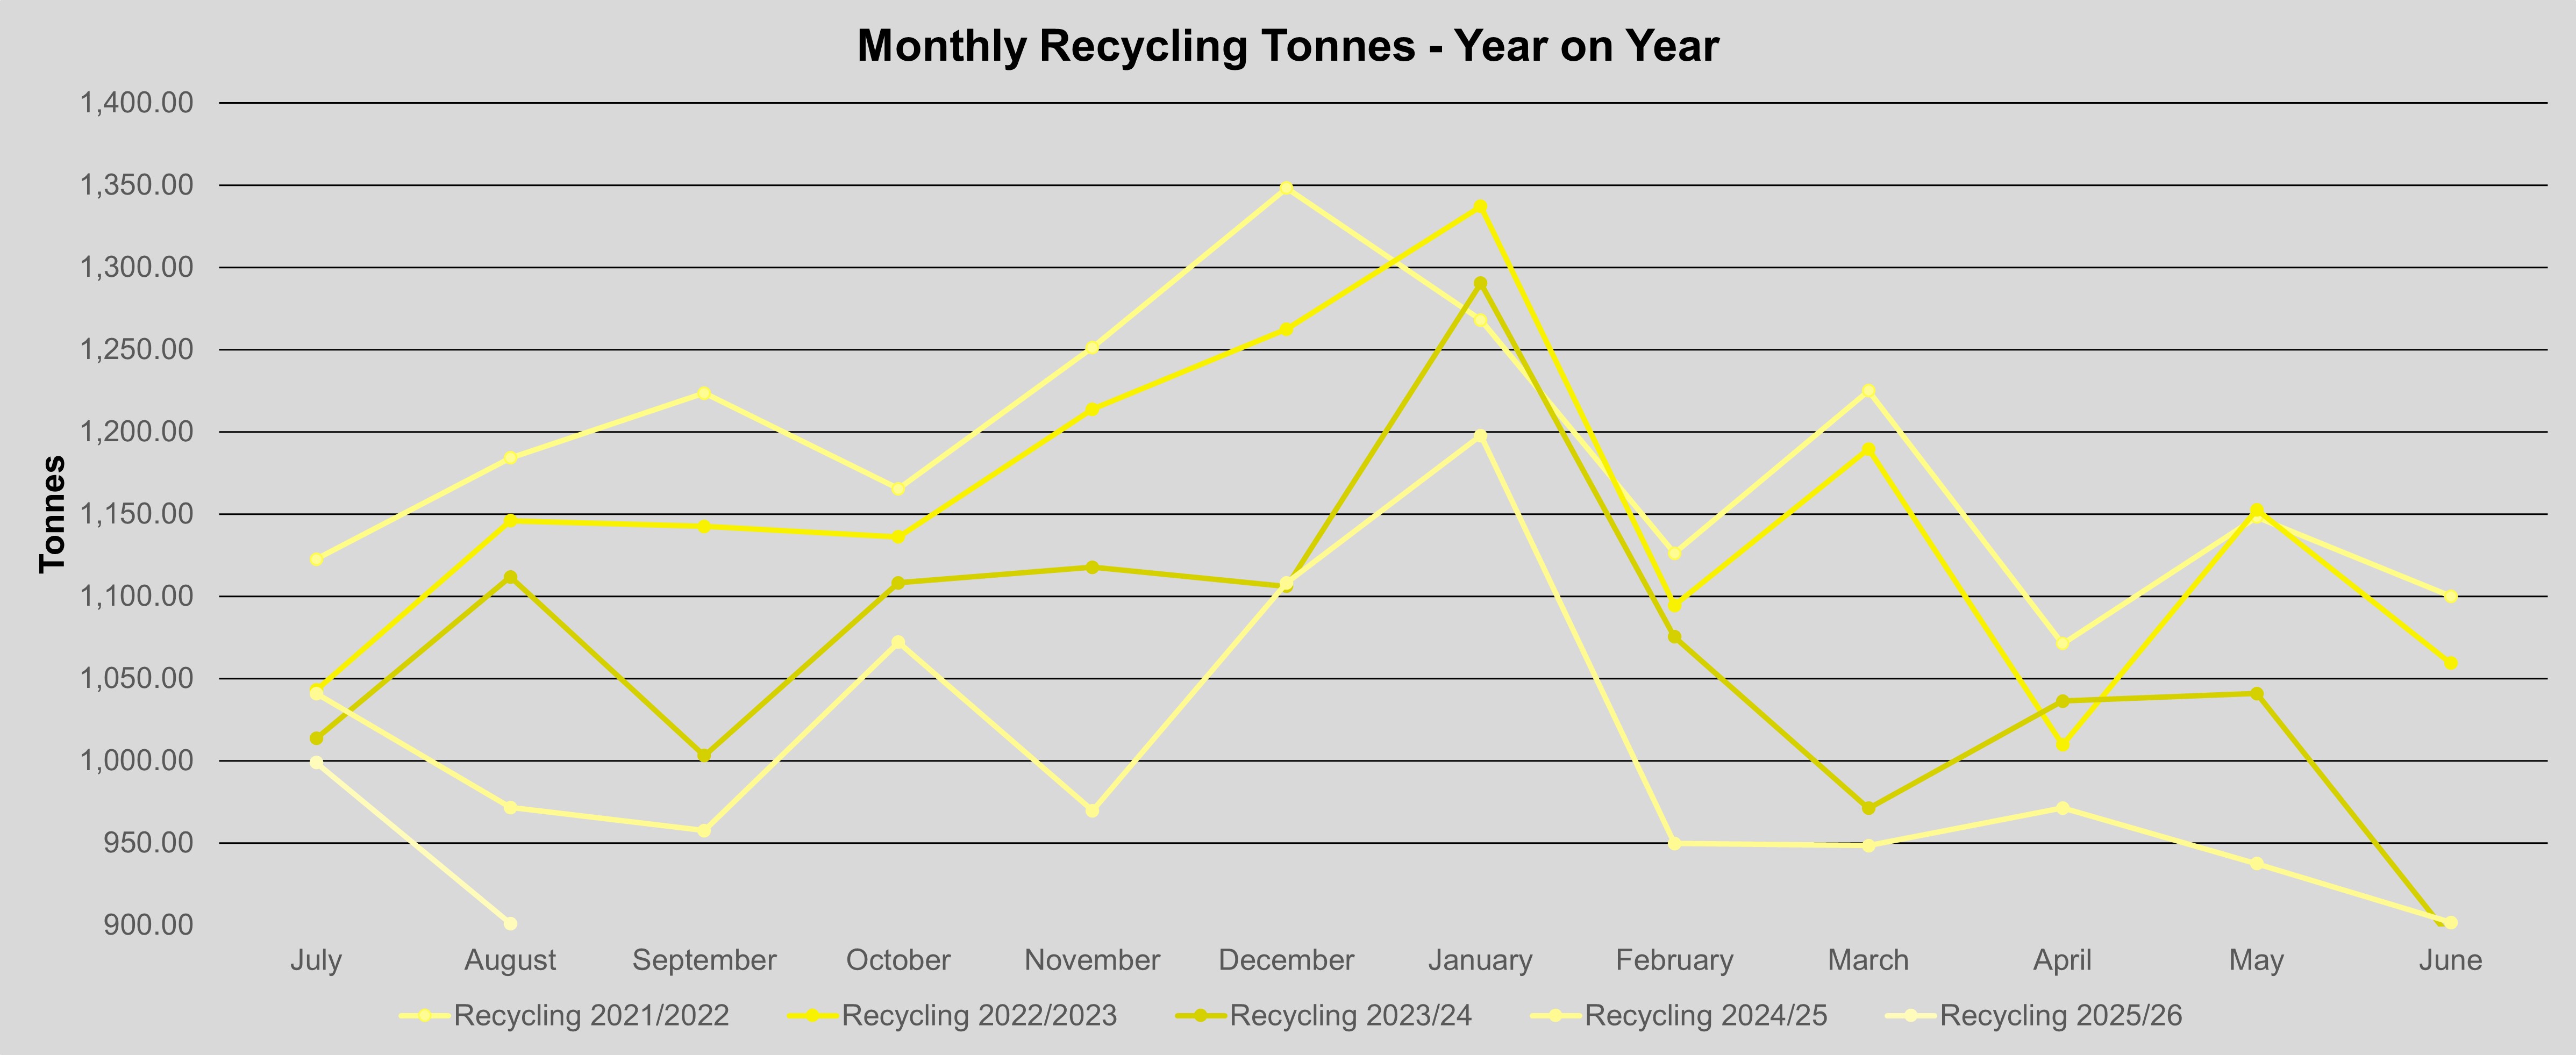
- Commingled recycling has continued its downward trend, down around 740 tonnes (6%) in 2024/25 compared to the previous year this is 1% less than 2023/24.
- The amount of co-mingled recycling material continues to be consistent with previous season trends, with higher amounts in December and January.
To benchmark Whitehorse City Council’s waste and recycling performance with other councils, check out Recycling Victoria Data Hub.
Additional data on waste and recycling performance is available from the State Government, for further information visit the Know Your Council Comparison Dashboard.
A breakdown of the amount of waste and recycling collected, recycling composition and hard waste bookings can be found below.
Presentation of Data
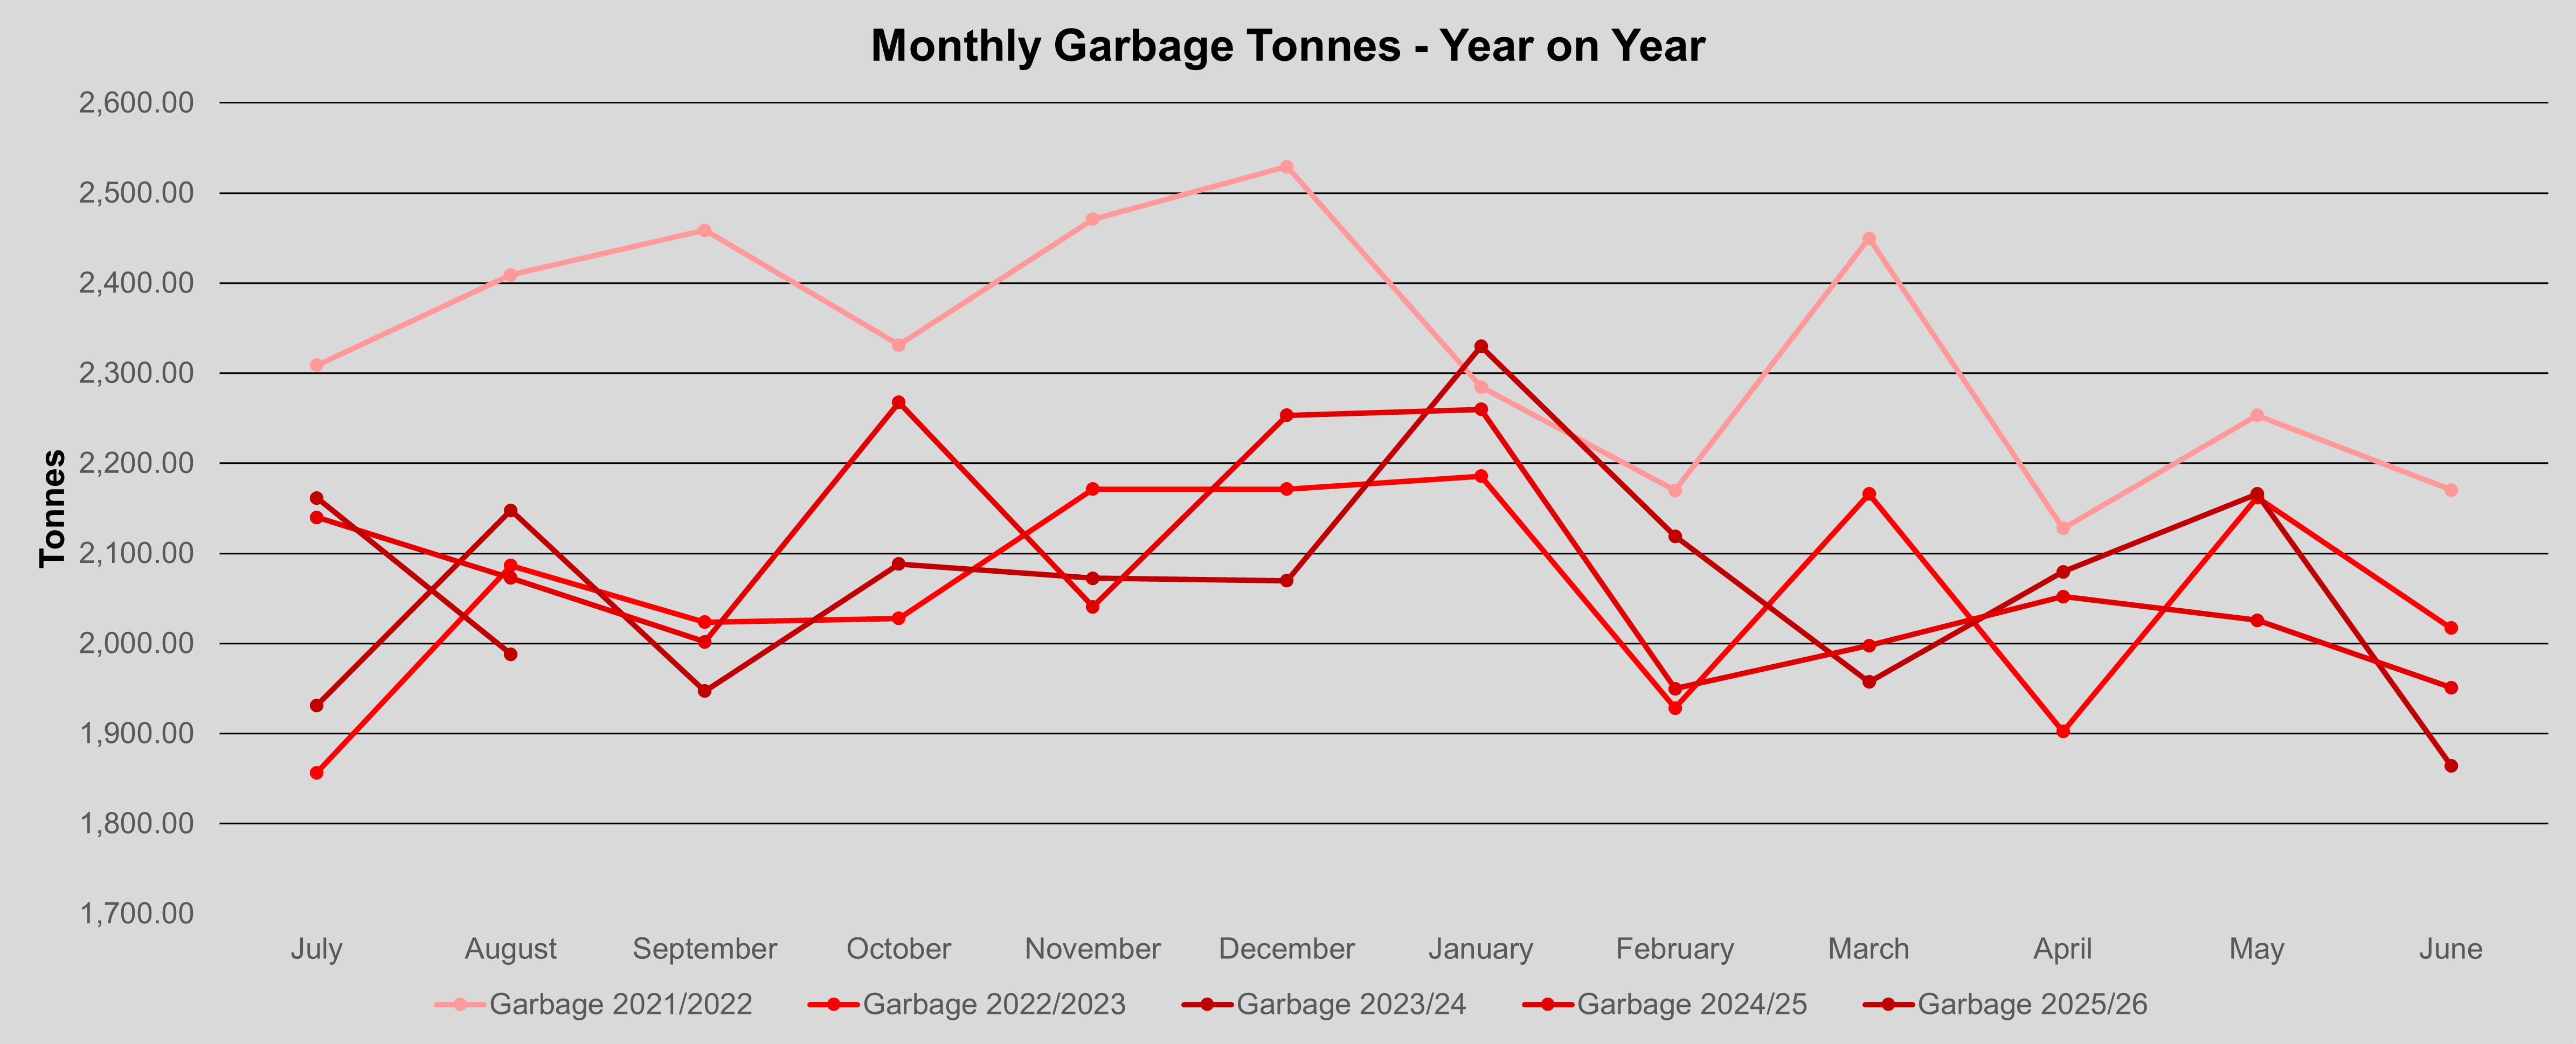
Monthly Garbage (Tonnes)
Monthly Commingled Recycling (Tonnes)
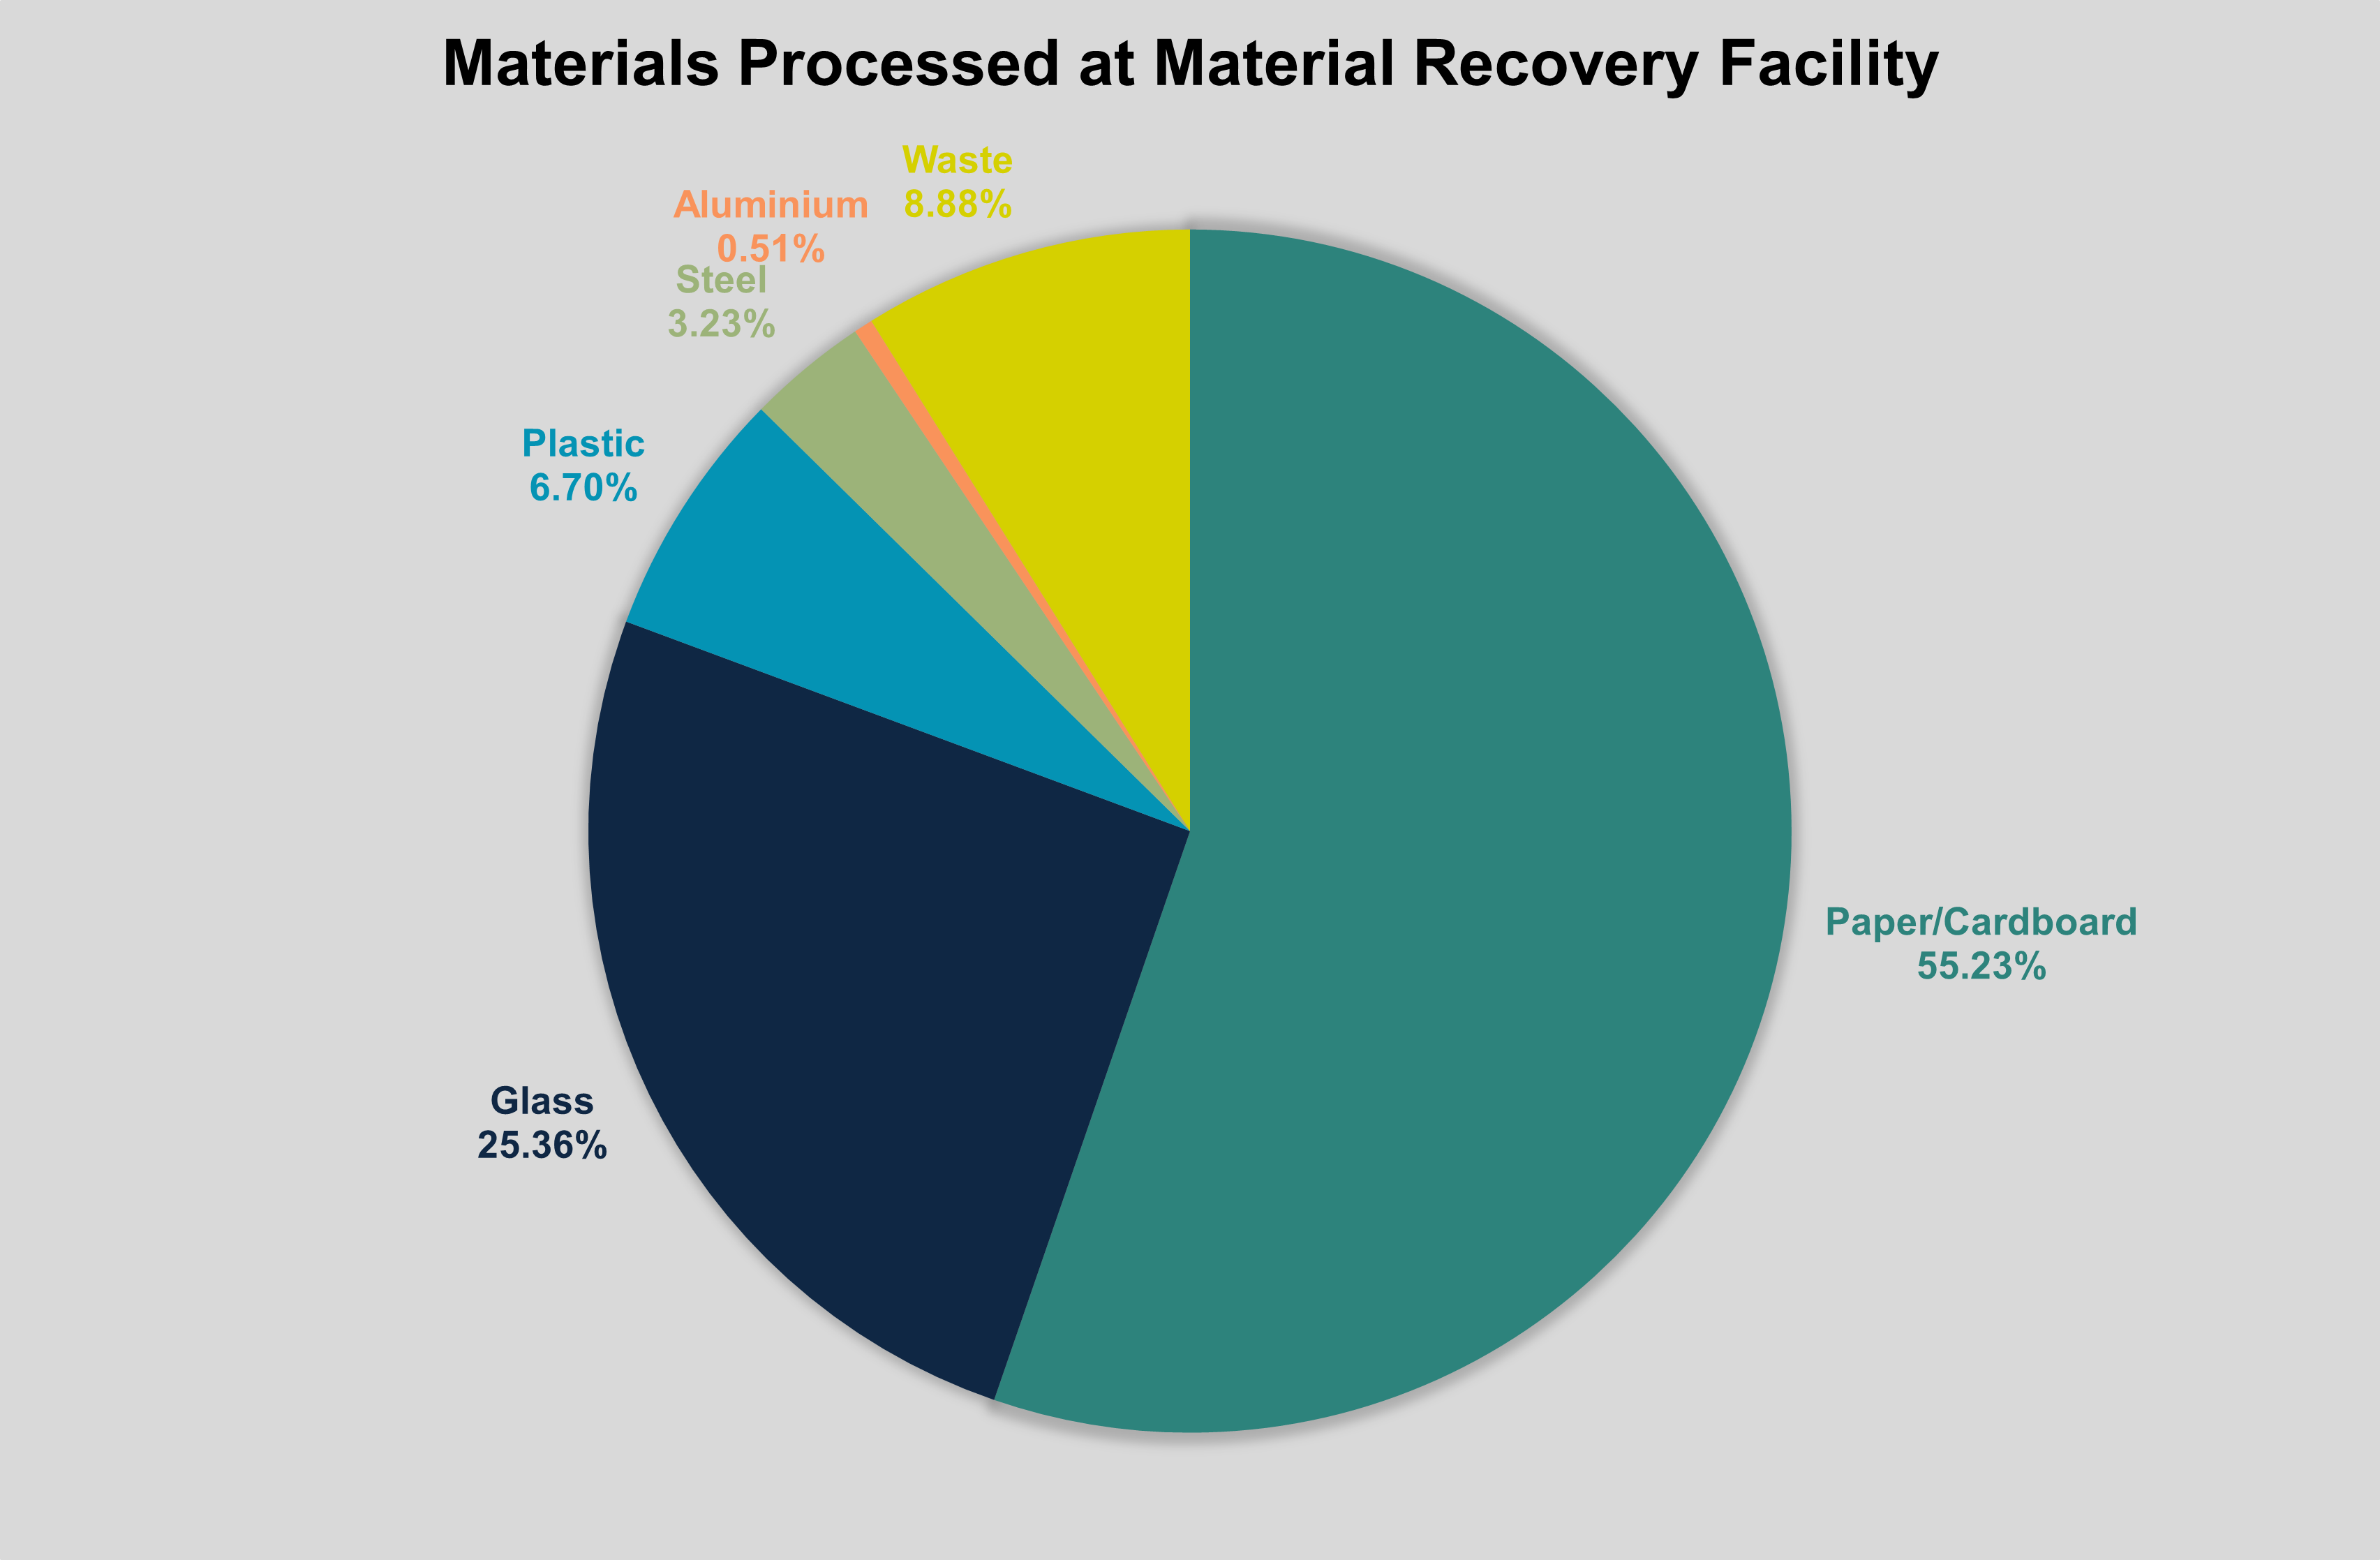
Commingled recycling - composition and how it is processed
Council’s commingled recycling material is taken to the Visy Material Recovery Facility (MRF) in Springvale or Heidelberg, where it is sorted into material groups including paper and cardboard, glass, plastics, aluminium and steel. By weight, paper, cardboard and glass make up close to 80% of the materials recovered from the kerbside recycling bin. For further information on what happens to recyclable materials, visit What Happens to Your Waste and Recycling.
Container Deposit Scheme (CDS)
Council receives Container Deposit Scheme income through the yellow recycling bin, in alignment with the Circular Economy (Waste Reduction and Recycling) Act 2021. This income offsets the kerbside recycling service.
|
Mar-24 |
$128,353 |
|
Jun-24 |
$169,699 |
|
Sep-24 |
$130,675 |
|
Dec-24 |
$115,945 |
|
Mar-25 |
$147,105 |
|
Jun-25 |
$101,083 |
|
Sep-25 |
$102,596 |
|
Total |
$895,456 |
Monthly Food Organics and Garden Organics (FOGO) (Tonnes)
Total Annual Tonnes per Stream
Percentage of Waste Diverted from Landfill