This factsheet provides data broken down by sex for residents of the City of Whitehorse.
Age
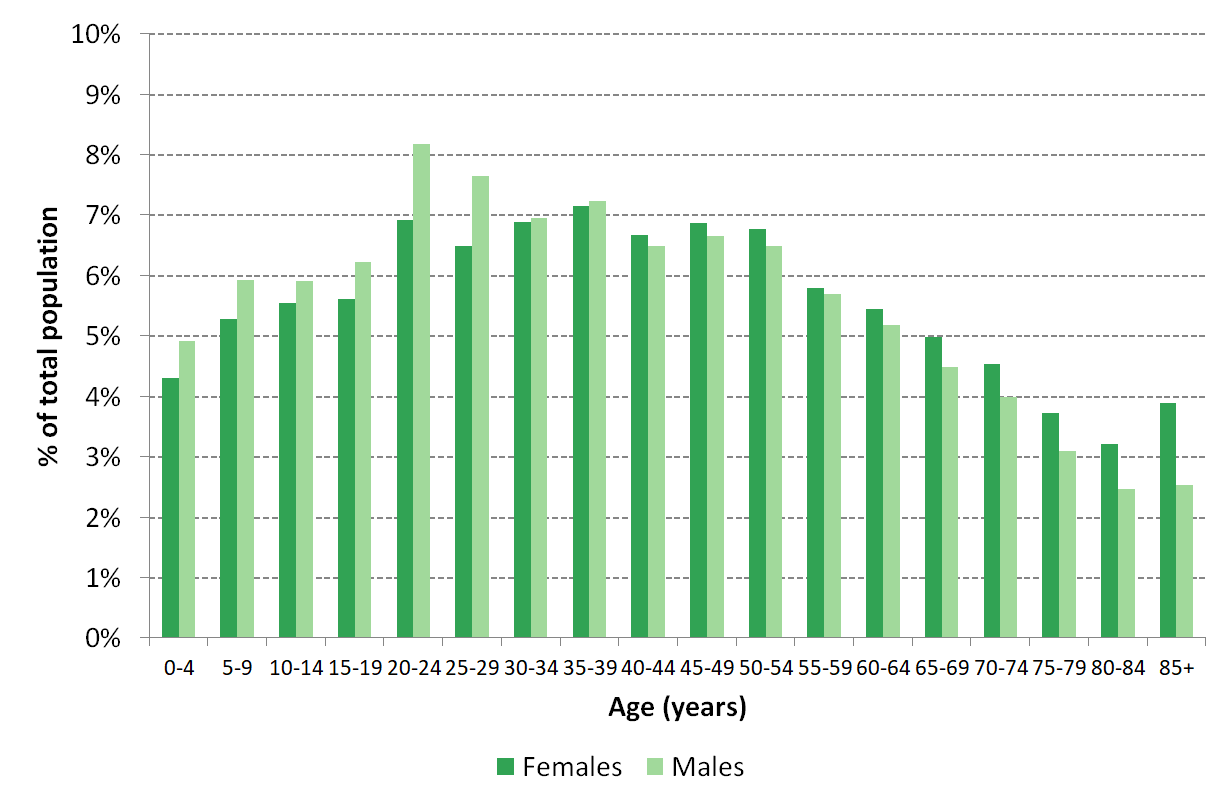
Current official population estimates show that females in Whitehorse comprise 52 percent of the population and males comprise 48 percent. Across the age groups for females and males, there are higher proportions of females compared with males in the older years. This pattern in respective age distributions reflects the longer life expectancies of women and is consistent with Victorian and Australian trends.
Non-English Speaking Countries of Birth
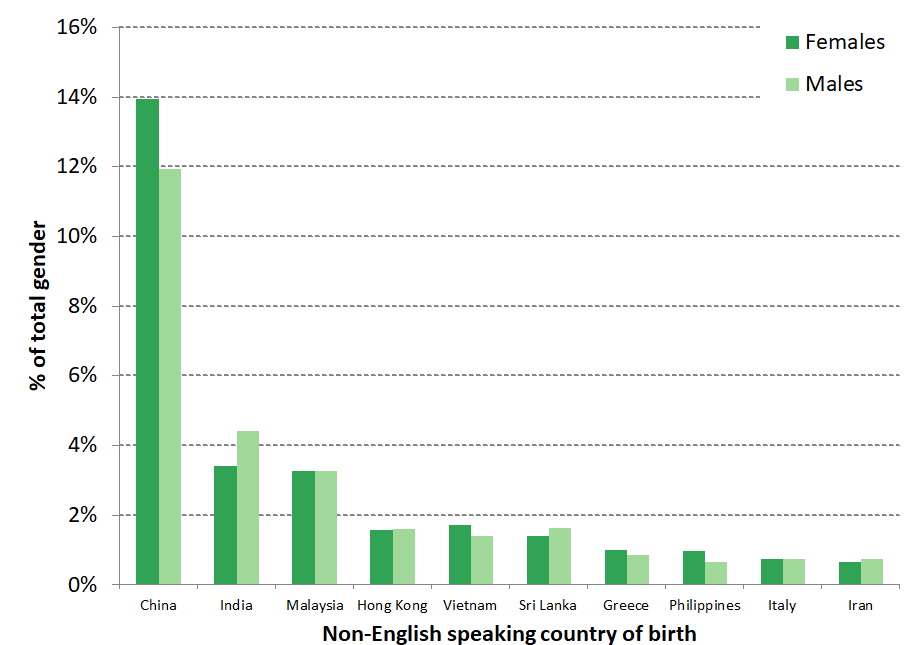
Figure 2 depicts the top ten non-English speaking countries of birth in Whitehorse by gender. A higher proportion of females are from China, Vietnam, Greece and Philippines (marginally). Females born in Greece and Italy are an older group, with relatively high proportions (88 and 85 percent respectively) aged 60 years or more. The largest proportion of females born in China, India, Malaysia, Hong Kong, Vietnam, Sri Lanka, the Philippines and Iran are aged 24-44 years.
Language Proficiency
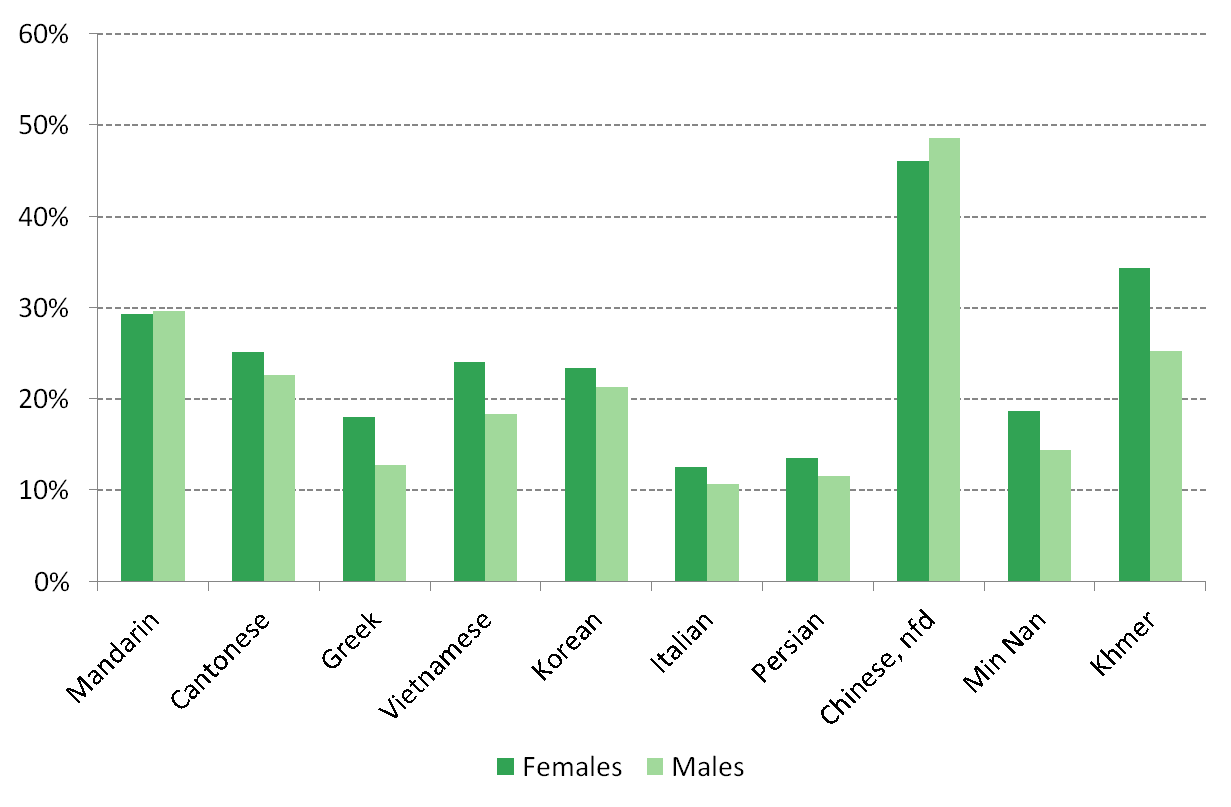
Females who speak languages other than English at home are generally less proficient in spoken English than their male counterparts. The languages for which this pattern is most evident are Greek, Vietnamese and Khmer. In 2021, 17.9 percent of females who spoke Greek at home spoke English either ‘not well’ or ‘not at all’, compared with 12.7 percent for males; 24 percent of females speaking Vietnamese spoke English either ‘not well’ or ‘not at all’, compared with 18.3 per cent of males; and 34.4 percent of females speaking Khmer spoke English either ‘not well’ or ‘not at all’, compared with 25.2 per cent of males.
Lone Person Households
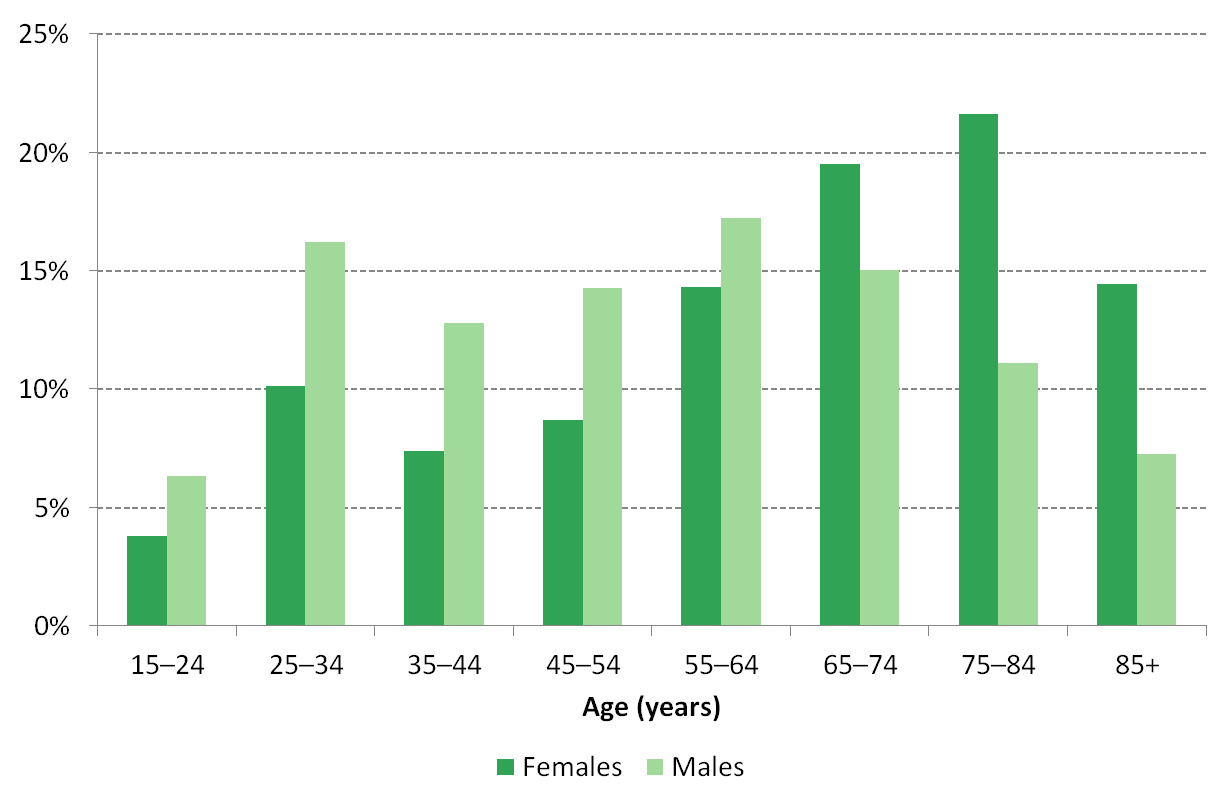
There are 15,881 lone-person households in Whitehorse, of which 61.8 percent are female occupied. Females in lone-person households have an older age profile than their male counterparts, with higher proportions aged 65 plus years. This pattern is consistent with Greater Melbourne and the other local government areas of the Eastern Metropolitan Region.
Lone Parent Households
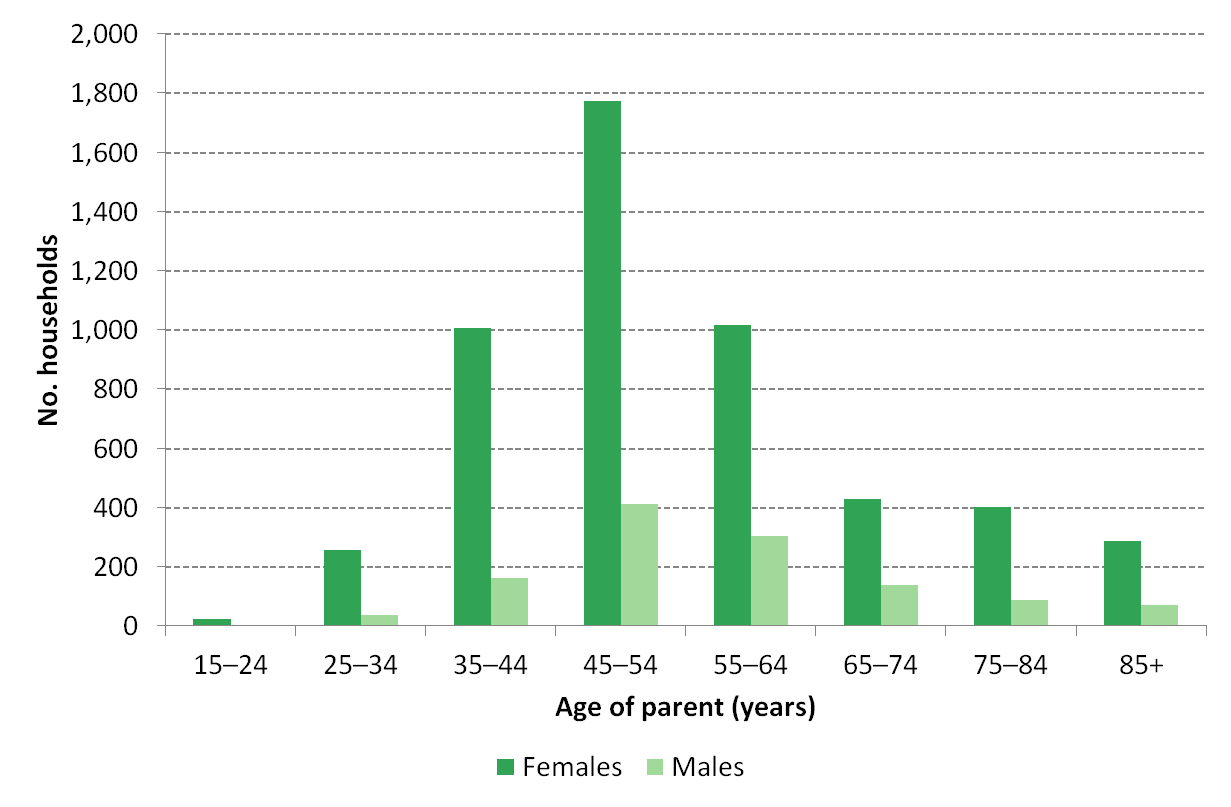
There are 6,394 lone-parent households in Whitehorse, of which 81 percent have a female head. Females heading lone-parent households have a younger age profile than their male counterparts, with higher proportions aged less than 45 years. This pattern is consistent with Greater Melbourne and the other local government areas of the Eastern Metropolitan Region. Lone-parent families are more likely to experience socio-economic disadvantage and be exposed to risks of poorer health and wellbeing.
Level of Educational Attainment
In Whitehorse, females are more likely than males to have achieved a graduate diploma/certificate, bachelor degree, and advanced diploma/diploma as their highest level of education. Males are more likely than females to have achieved a postgraduate degree or a certificate as their highest level of education.
| Highest Level of Qualification | Females | Males |
|---|---|---|
| Bachelor or Higher Degree | 42.5% | 40.8% |
| Advanced Dip, Diploma | 10.6% | 96% |
| Vocational | 7.6% | 13.1% |
| No qualification | 32.5% | 30.4% |
| Not stated | 6.8% | 6.1% |
Individual Income
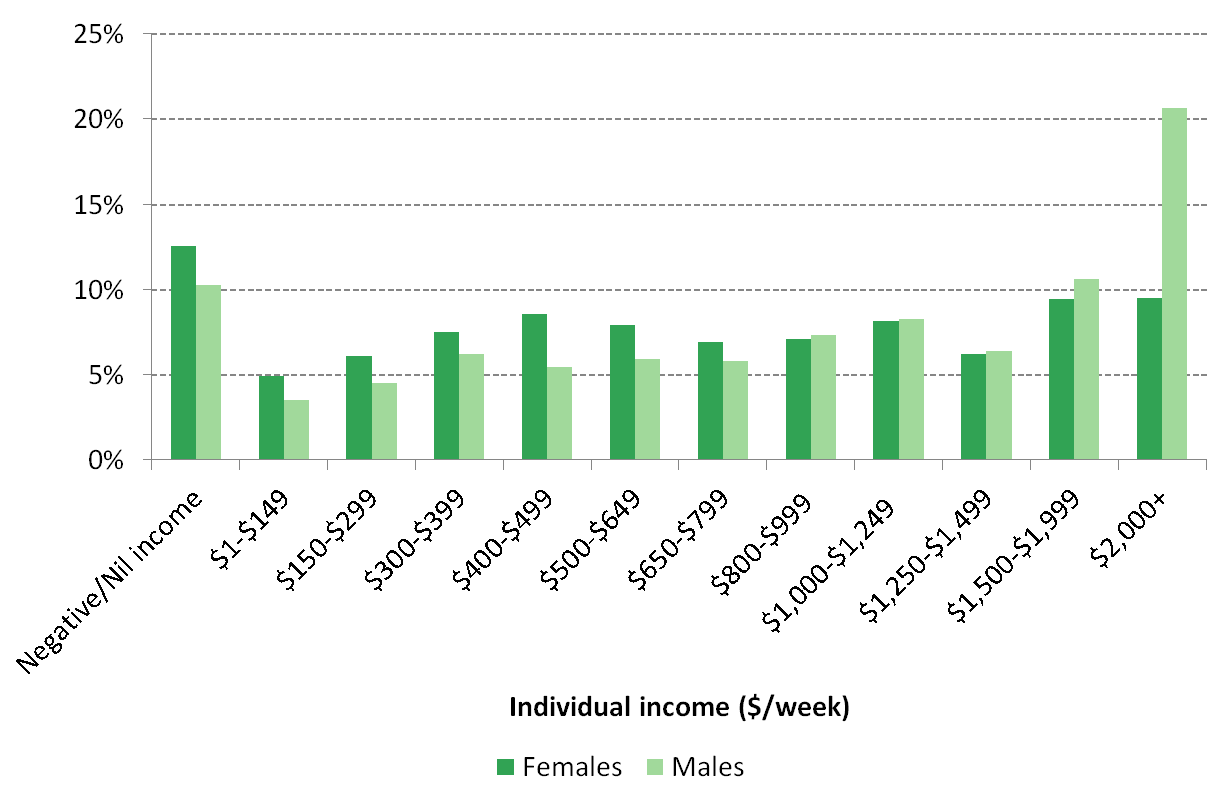
In Whitehorse, females are more represented in lower weekly income brackets and males are more represented in higher weekly income brackets. This difference in individual incomes has far-reaching consequences for women over their lifetime, particularly given their longer life expectancies. Women often reach later years in life with far less savings and smaller amounts of superannuation than men.
Occupations and Industries
In Australia, occupations and industries are highly segregated along gender lines, with certain jobs (such as community services work) and industries (such as the education and training sector) dominated by women.
Working females in Whitehorse are more represented than males in occupations such as professional, community and personal services, clerical and administrative, and sales. Males are more represented than females in occupations such as managers, technicians and trades, machinery operators/drivers, and labourers.
Working females in Whitehorse are more represented than males in industries such as education and training, and health care and social assistance, and retail. Males are more represented than females in industries such as manufacturing, construction, wholesale trade, transport/postal/warehousing, information/media/ telecommunications, and professional, scientific and technical services.
| Occupation | Females | Males |
|---|---|---|
| Managers | 11.4% | 17.2% |
| Professionals | 35.8% | 31.2% |
| Technicians and trades | 3.9% | 15.2% |
| Community and personal services | 13.6% | 5.8% |
| Clerical and administrative | 18.3% | 7.7% |
| Sales | 10.0% | 7.3% |
| Machinery operators/drivers | 0.9% | 5.4% |
| Labourers | 4.6% | 8.2% |
| Not stated | 1.6% | 2.0% |
Unpaid Domestic Work
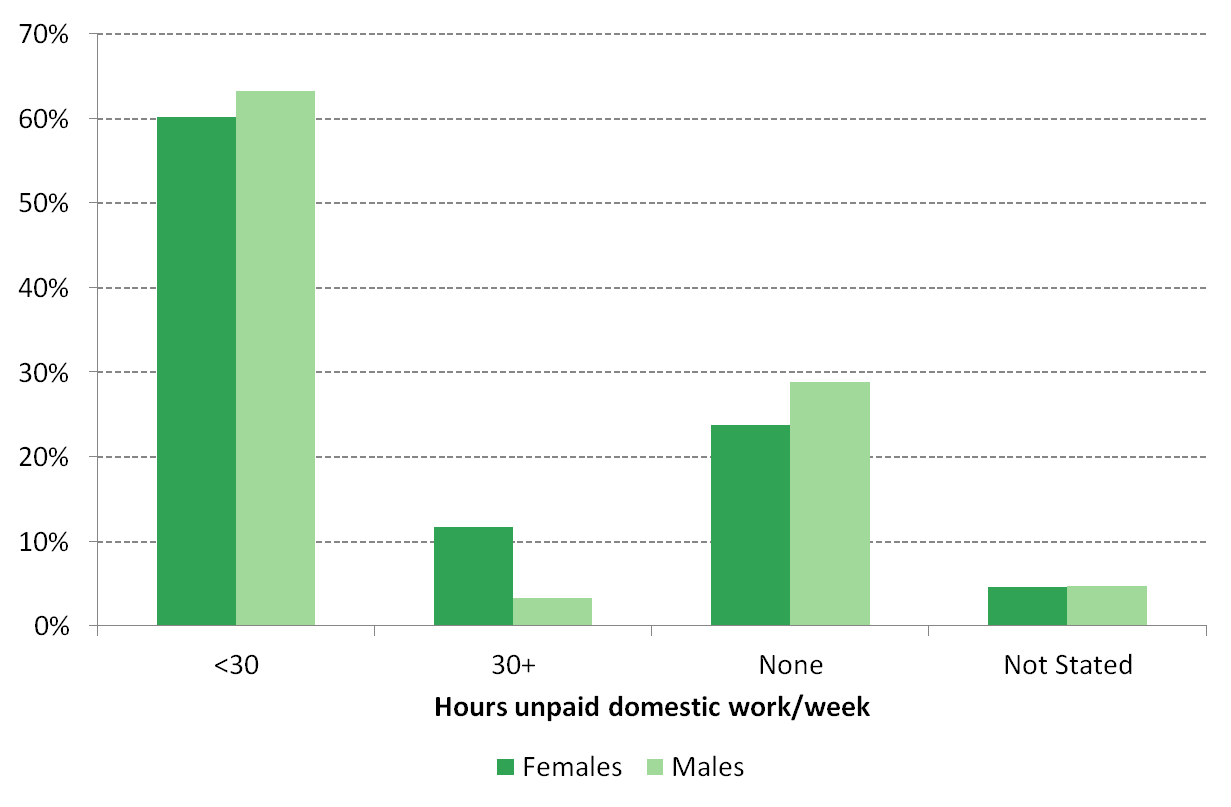
In Whitehorse males are more likely than females to spend less than 30 hours each week on unpaid domestic work. Males are more likely than females to not do unpaid domestic work during the week. Females are also much more likely than males to spend 30 hours or more on unpaid domestic work each week.
Assistance to a Person with a Disability
In Whitehorse, females are more likely than males to provide help to a family member and/or other person with a long-term disability/illness over a fortnightly period. Males are more likely than females not to provide such assistance over a fortnight period.
| Over a Fortnight | Females | Males |
|---|---|---|
| Assistance given | 14.5% | 11.0% |
| Assistance not given | 80.9% | 84.3% |
| Not stated | 4.6% | 4.7% |
Care of Dependent Children
In Whitehorse, females are more likely than males to provide care to dependent children over a fortnight period. Males are more likely than females not to provide such care over a fortnight period.
| Over a Fortnight | Females | Males |
|---|---|---|
| Care given | 27.7% | 23.6% |
| Care not given | 68.0% | 71.8% |
| Not stated | 4.4% | 4.6% |
| Total (persons aged 15+) | 74,206 | 68,185 |
Links
For more information about gender refer to: