This fact sheet provides information about Community Safety in the City of Whitehorse.
Crime
Crime statistics are published annually by the Crime Statistics Agency on behalf of Victoria Police. Offence summaries are reported per 100,000 population to allow for comparisons between different areas.
The rate of criminal incidents reported in Whitehorse has historically been significantly lower than the Victorian average (see Figure 1 below). For the year ending March 2025, the criminal incident rate in Whitehorse was 5,003.2 per 100,000 population, compared to 6,692.2 for Victoria. This represents a 23.2 per cent increase on the number of incidents reported in 2024.
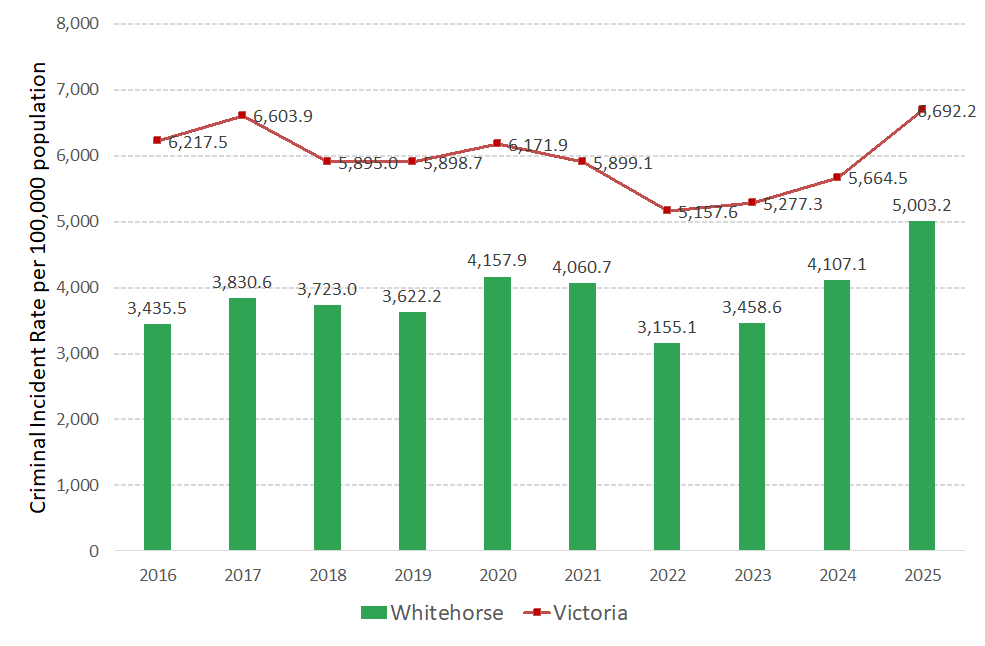
Source: Crime Statistics Agency (2025)
Community Safety

Offences against the person in Whitehorse remain lower than both the Eastern Metropolitan Region and the State average. In contrast, offences against property in Whitehorse are higher than the Eastern Metropolitan average but still below the State average.
In 2025, Whitehorse recorded 550 offences against the person per 100,000 population, compared to 635 in the Eastern Metropolitan Region and 1,369 across Victoria.
For offences against property, Whitehorse recorded 3,947 per 100,000 population, compared to 3,442 in the Eastern Metropolitan Region and 5,222 across Victoria.
Family Violence
Family violence is a significant social, economic and health problem. Family violence is predominantly perpetrated by men against women, however, it affects people throughout the community regardless of gender, age, sexuality, cultural background and socioeconomic class. Violence against women contributes 5.1 per cent towards the burden of disease in Australian women aged 18-44 years.
| Family violence incident rate per 100,000 population (July – June) | ||||||
|---|---|---|---|---|---|---|
| LGA | 2019-20 | 2020-21 | 2021-22 | 2022-23 | 2023-24 | % change 2022/23 – 2023/24 |
| Boroondara | 534 | 584 | 601 | 600 | 604 | 0.7% |
| Knox | 1,171 | 1,214 | 1,215 | 1,218 | 1,229 | 0.9% |
| Manningham | 597 | 727 | 749 | 774 | 774 | 0.0% |
| Maroondah | 1,104 | 1,212 | 1,196 | 1,146 | 1,187 | 3.6% |
| Monash | 720 | 938 | 1,365 | 907 | 916 | 1.0% |
| Whitehorse | 736 | 854 | 799 | 823 | 838 | 1.8% |
| Yarra Ranges | 1,333 | 1,097 | 1,247 | 1,246 | 1,265 | 1.5% |
| Victoria | 1,333 | 1,427 | 1,365 | 1,366 | 1,418 | 3.8% |
Source: Crime Statistics Agency (2025), Family Violence Data Portal
On average 29 incidents of family violence in Whitehorse were reported to police every week throughout 2023/24. The rate of family violence incidents in Victoria per 100,000 of the population was approximately 1.7 times that of Whitehorse in 2023/24, at 1,378 and 839 respectively.
Feeling of Trust
How close someone is to their family, friends and people they know can sometimes be connected to longer life expectancy. Being close to others can help you stay healthier in your body and mind. It can also help you when times are tough, like when you're not feeling well or when you are experiencing financial hardship. The Victorian Population Health Survey 2020 asked respondents 'do you agree most people can be trusted?'. In Whitehorse 37.5 per cent agreed that 'yes definitely' most people could be trusted (compared to 35.2 per cent for Victoria), while 14.3 per cent said 'never or not often' (similar to Victoria at 14.2 per cent).
Links
This factsheet provides information about Community Safety in the City of Whitehorse. For more information refer to: