This page provides statistical information on housing in the City of Whitehorse.
Median House Prices
In 2023 the median house price in Whitehorse was $1,376,000. This is considerably higher than the equivalent for the Melbourne Metropolitan area ($860,000). Whitehorse has the 10th highest median house price of the 79 local governments in Victoria.
The median house price in the municipality has decreased over the past 12 months (see Table 1), consistent with metropolitan Melbourne.
| Year | Whitehorse | Metropolitan Melbourne |
|---|---|---|
| 2013 | $941,624 | $675,372 |
| 2014 | $1,051,829 | $704,599 |
| 2015 | $1,285,886 | $749,060 |
| 2016 | $1,340,182 | $790,155 |
| 2017 | $1,506,576 | $870,573 |
| 2018 | $1,358,487 | $877,974 |
| 2019 | $1,296,085 | $840,704 |
| 2020 | $1,366,249 | $868,379 |
| 2021 | $1,547,703 | $979,274 |
| 2022 | $1,404,440 | $939,813 |
| 2023 | $1,376,000 | $860,000 |
Source: Department of Transport & Planning (2024), ‘Property Sales Statistics’, viewed November 2024
NB: All values have been adjusted to 2023 dollars as at June 2023.
Housing Tenure
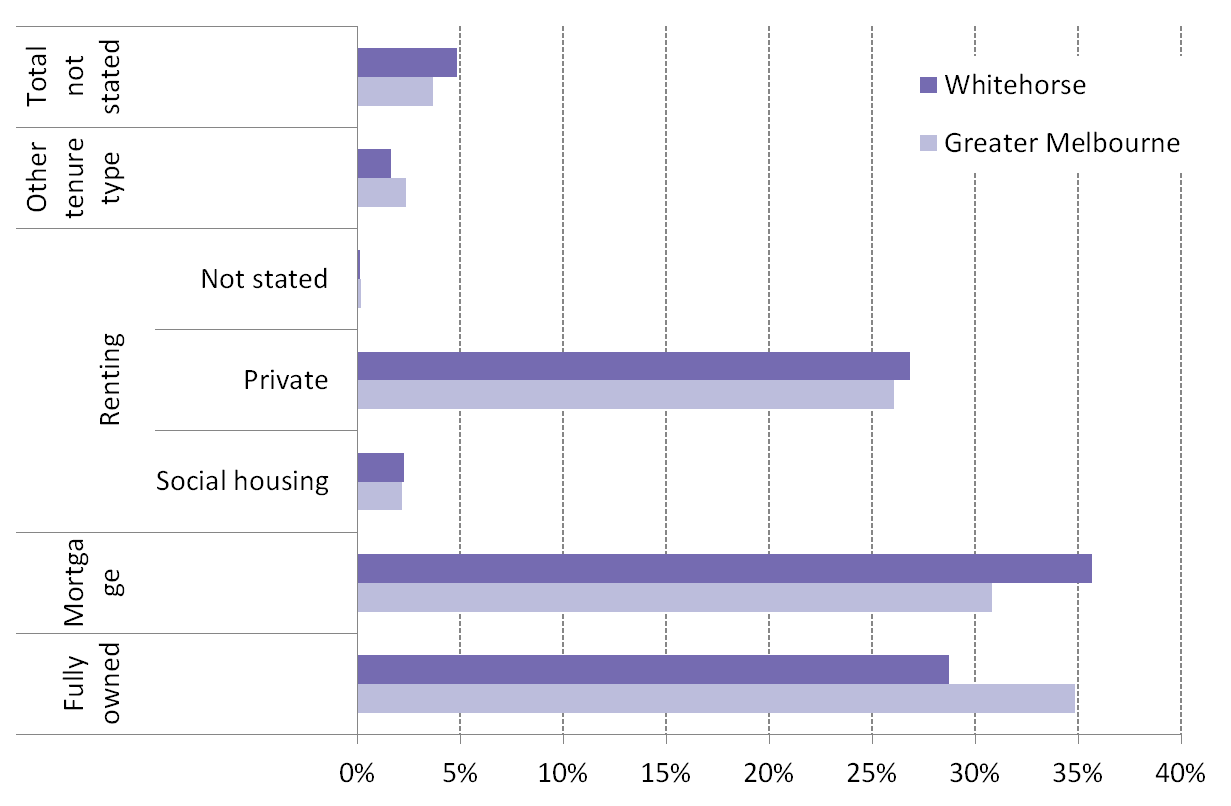
A total of 34.8 per cent of households in Whitehorse own their own home. This is considerably higher than Greater Melbourne at 28.7 per cent. Such elevated level of home ownership means there are fewer households renting or purchasing homes.
However, numbers of households owning their own homes have fallen since the 2006 Census, continuing a trend both in Whitehorse and Greater Melbourne. The number of people purchasing homes has fallen slightly, but there has been a continuing rise in the number of people entering the rental market. This is significant as it means an increase in the number of households susceptible to housing stress.
Source: Australian Bureau of Statistics (2021), Census of Population and Housing
Median Rents
Median rents have increased across Metropolitan Melbourne over the past 12 months. Table 2 outlines the median rents for municipalities across the Eastern Metropolitan Region (EMR). In the 12 months to June 2024, Whitehorse experienced an increase in median rents for almost all property types. The biggest increase in rent in Whitehorse occurred in 2 bedroom houses (11.5 per cent), followed by 3 bedroom houses (8.6 per cent). It was less expensive to rent a 2 bedroom house compared to a 2 bedroom flat. 2 bedroom flats comprise the largest number of rental properties in Whitehorse (38.8 per cent of total rentals).
| LGA | 1 bedroom flat | 2 bedroom flat | 2 bedroom house | 3 bedroom house |
|---|---|---|---|---|
| Boroondara | $450 | $575 | $650 | $795 |
| Knox | $433 | $503 | $520 | $590 |
| Manningham | $480 | $580 | $595 | $675 |
| Maroondah | $380 | $510 | $515 | $600 |
| Monash | $470 | $560 | $550 | $630 |
| Whitehorse | $460 | $560 | $535 | $630 |
| Yarra Ranges | $350 | $500 | $520 | $585 |
| EMR | $460 | $550 | $550 | $620 |
Source: DFFH (2024), Rental Report December 2024, viewed July 2025.
NOTE: EMR data is based on the median rent and the number of properties available.
Social Housing
Approximately 1,415 households nominated as living in social housing in the 2021 Census. This is 2.2 per cent of all households in the municipality.
Table 3 summarises the number of social housing properties in the EMR and in other regions in 2021. While the rate of social housing in Whitehorse is the second highest in the east, as a region the EMR has significantly less public housing than the other metropolitan regions – approximately 6 properties per 1,000 estimated residential population, compared with 10.2 and 8.1 for the north and west metropolitan, and southern metropolitan regions respectively. This should not be considered a reflection of lack of demand; rather that supply levels are low.
| LGA / REGION | NUMBER OF PROPERTIES | RATE PER 1,000 ESTIMATED RESIDENTIAL POPULATION |
|---|---|---|
| Boroondara | 607 | 3.6 |
| Knox | 1,183 | 7.4 |
| Manningham | 258 | 2.1 |
| Maroondah | 1,064 | 9.2 |
| Monash | 1,442 | 7.5 |
| Whitehorse | 1,415 | 8.3 |
| Yarra Ranges | 580 | 3.7 |
| Eastern Metropolitan Region |
6,549 | 6.0 |
| North and West Metropolitan Region |
22,483 | 10.2 |
| Southern Metropolitan Region |
12,851 | 8.1 |
Source: Australian Bureau of Statistics (2021), Census of Population and Housing. Rates based on ERP as at June 2021.
Housing Stress
Households are generally accepted to be in ‘housing stress’ when they spend more than 30 per cent of their income on housing. Housing such an outlay may affect their ability to meet other basic needs, particularly where they are in the lowest 40 per cent of income earners.
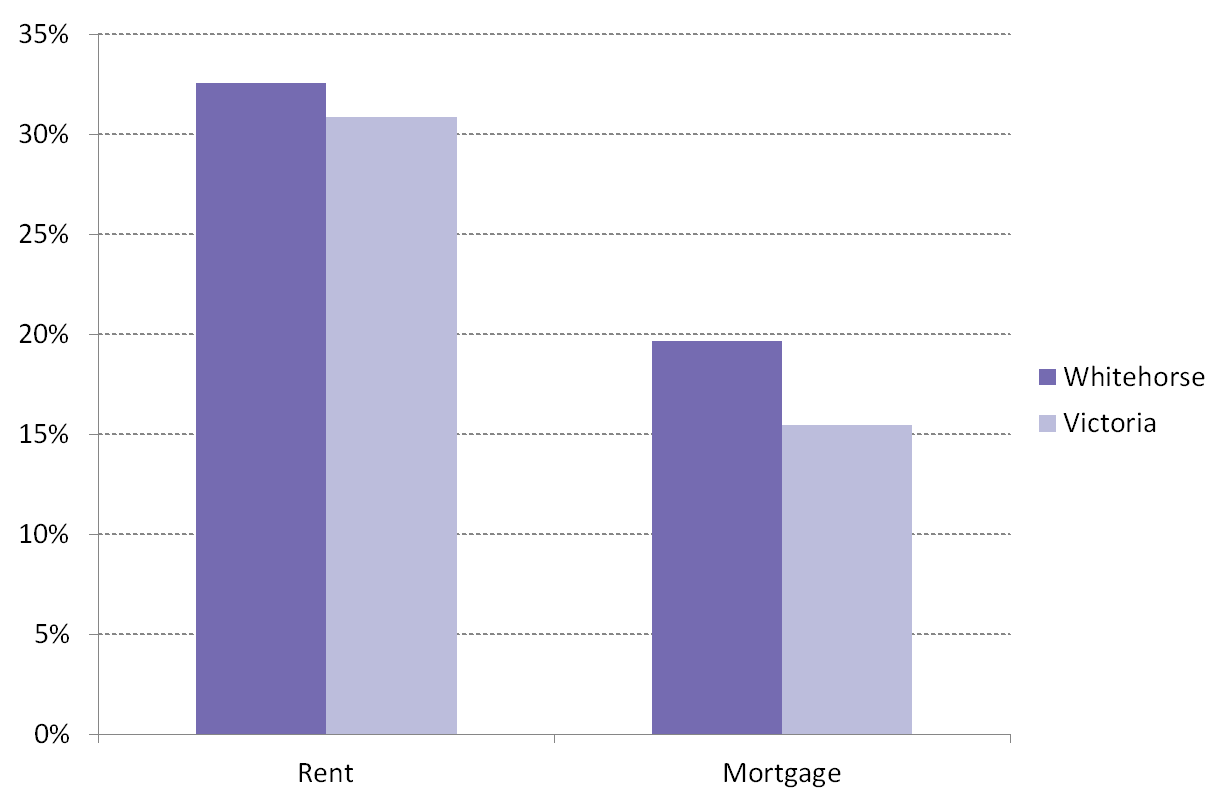
In Whitehorse the proportion of renters in housing stress has increased from 30.9 per cent in 2016, to 32.6 per cent in 2021, slightly higher than the Victorian average of 30.9 per cent.
Whitehorse also has a higher proportion of mortgage holders in housing stress (19.7 per cent) when compared to Victoria (15.5 per cent).
Source: Australian Bureau of Statistics (2022), Census of Population and Housing 2021.
These overall figures can mask the variation that exists within the municipality. For example, rental housing stress is highest in Box Hill, accounting for 44.4 per cent of all renters. This is followed by Burwood and Blackburn South, both with 35.3 per cent of renters. Similarly mortgage stress is greatest in Box Hill and Burwood East, accounting for 28.9 and 25.4 per cent of mortgagees respectively.
Figure 3 is a thematic map depicting where households are experiencing rental housing stress. It is based on the 2021 Census. The map shows high levels of housing stress around Box Hill (60.9 to 91.8 per cent in some areas) and high levels of stress around Burwood, Blackburn South, East Burwood, Blackburn and Box Hill North.
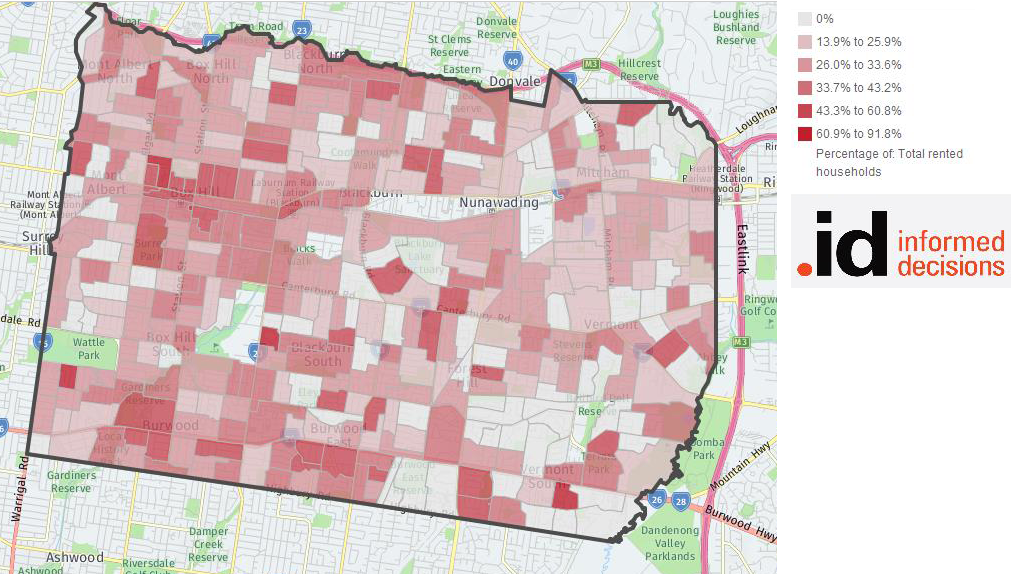
Source: ABS (2022), 2021 Census of Population and Housing, ‘City of Whitehorse, Housing Stress, accessed via Profile.ID, http://atlas.id.com.au/whitehorse.
Homelessness
In 2021 it was estimated that there were 1,491 homeless people in Whitehorse. This includes 785 living in boarding houses, 366 living in crowded or severely crowded housing and 244 living in supported accommodation for the homeless. The number of homeless people is often uncounted in the Census because it is challenging to find and count all homeless people, especially those sleeping rough.
Links
For more information about HOUSING refer to: