This factsheet provides information about transport for people living in the City of Whitehorse.
Public Transport
In 2021, 69.8 per cent of Whitehorse residents lived within 400 metres of public transport with regular 30 minute weekday service (7am to 7pm) (Australian Urban Observatory, 2024). This is considerably high, putting Whitehorse in the 71st percentile (although metropolitan municipalities would be expected to perform better in this respect).
Car Ownership
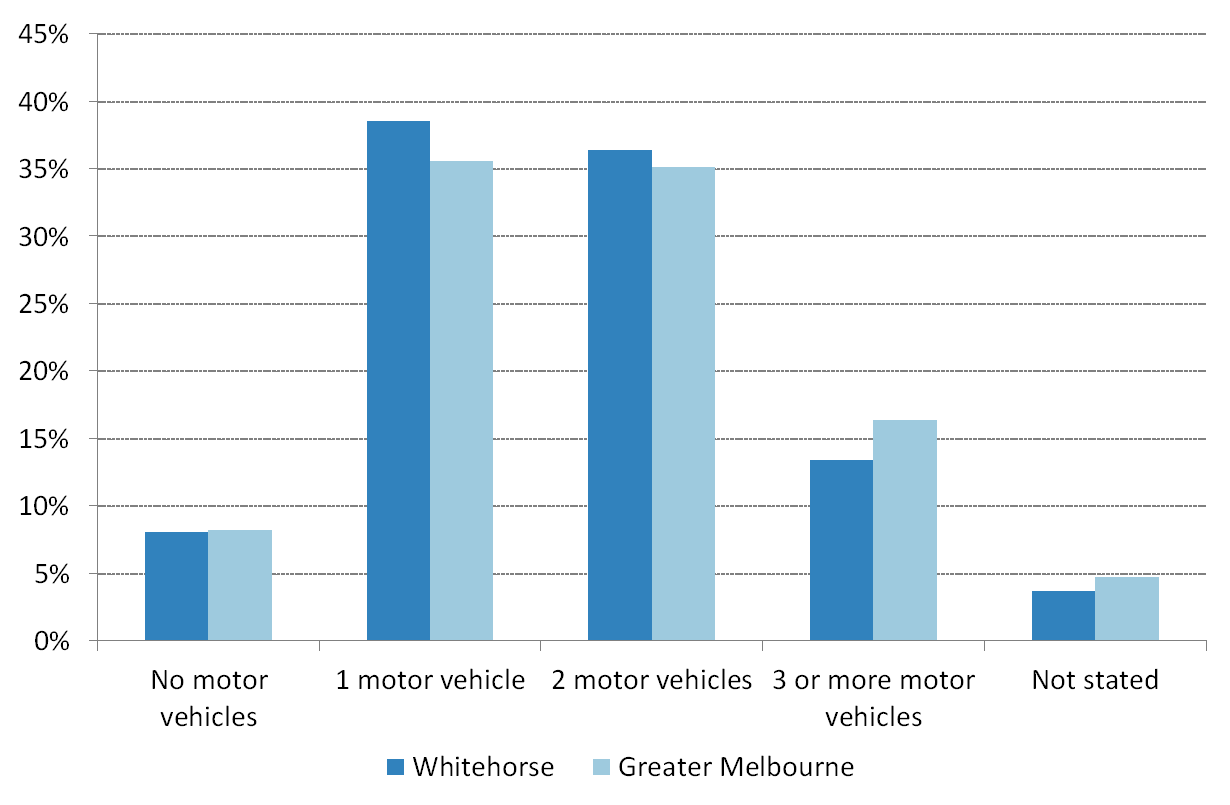
Levels of car ownership for a household affect mobility and transport choices, with zero-car households relying more heavily on alternative transport modes. According to the 2021 Census, approximately half of households (49.8 per cent) in the City of Whitehorse had access to two or more motor vehicles, compared with 51.5 per cent for Greater Melbourne. A total of 8 per cent of households in Whitehorse do not own a car.
Mode of Travel to Work
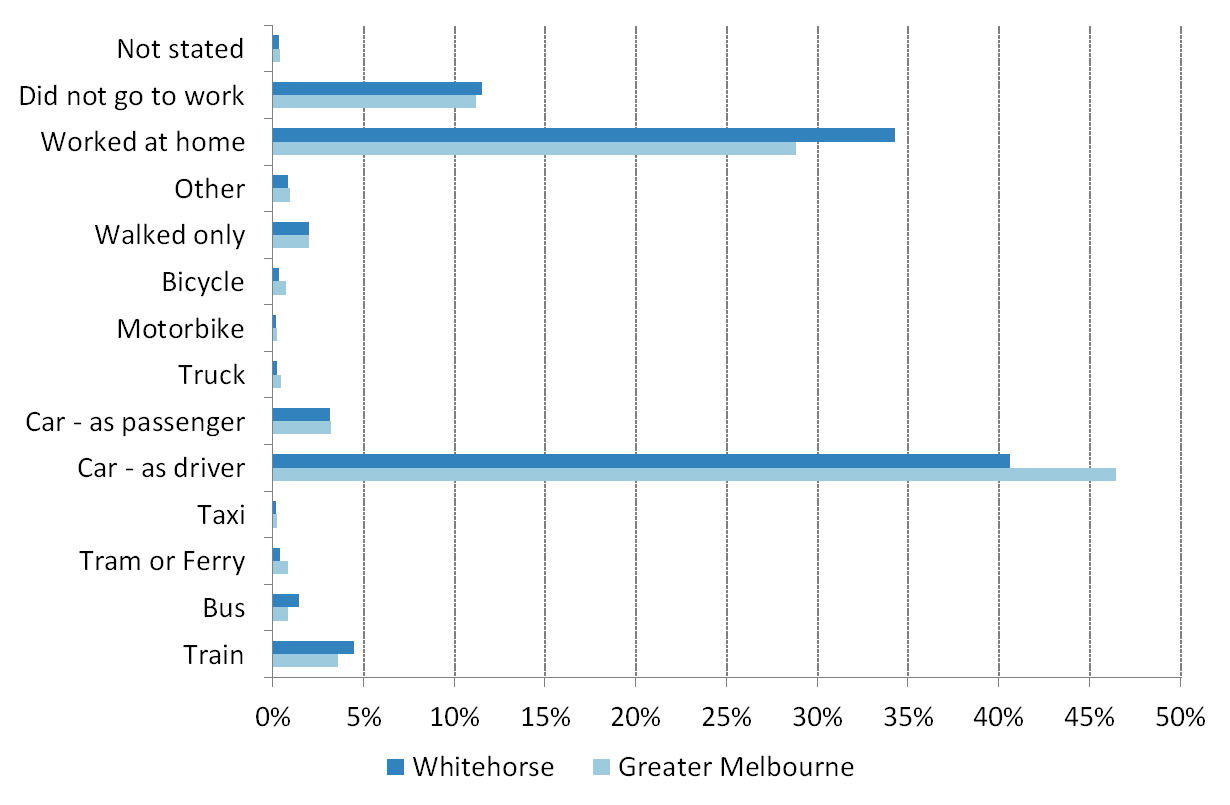
In 2021, 5,412 people (or 6.3 per cent of residents) in Whitehorse caught public transport to work (train, bus or tram), compared with 36,451 (43.7 per cent) who drove in private vehicles (car – as driver, car – as passenger, motorbike, or truck).
This is higher and lower than the equivalents for Greater Melbourne (at 5.3 per cent and 49.7 per cent respectively). More than a third of residents worked from home (34.3 per cent), however this figure was impacted by lockdowns in Melbourne as result of the COVID-19 pandemic. The same reason has contributed to the number of persons travelling by train decreasing by 69.1 per cent between 2016 and 2021.
Around 2.3 per cent of residents rode their bike or walked to work, which is less than the equivalent for Greater Melbourne at 2.7 per cent.
Road Safety
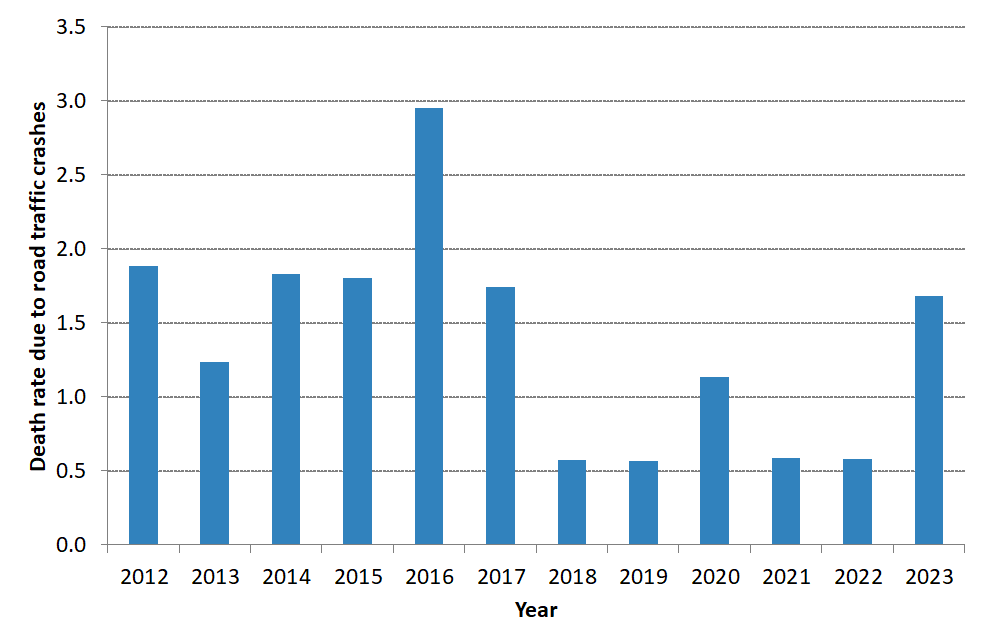
Data from VicRoads shows that between 2012 and 2023, there were 4,415 accidents where at least one person was killed or injured in Whitehorse. Of the 4,415 crashes, 28 people were killed, 1,245 people were seriously injured and 3,142 people sustained minor injuries.
Source: VicRoads Crashstats & ABS Estimated Residential Population
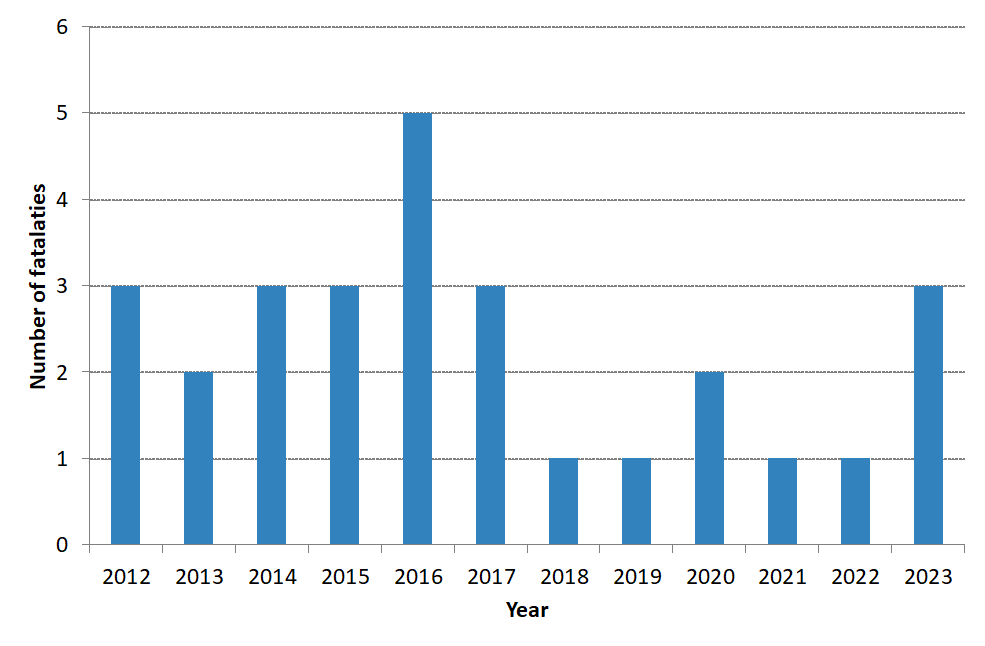
Source: VicRoads, Crashstats database, viewed July 2025.
Links
For more information about Transport please refer to: