This factsheet provides information about income, work, education and industry in the City of Whitehorse.
Economy
Whitehorse is home to 183,462 people, includes 19,243 local businesses, supports 87,988 jobs and had a gross regional product of $13.17 billion in 2024.
The Health Care and Social Assistance industry sector makes the greatest contribution to economic output in the region, which at $1.949 billion accounts for 18 per cent of total output.
With 20,441 jobs representing 23.2 per cent of total employment, Health Care & Social Assistance is the industry sector that is the region's largest employer.
Employment
In the 2021 Census:
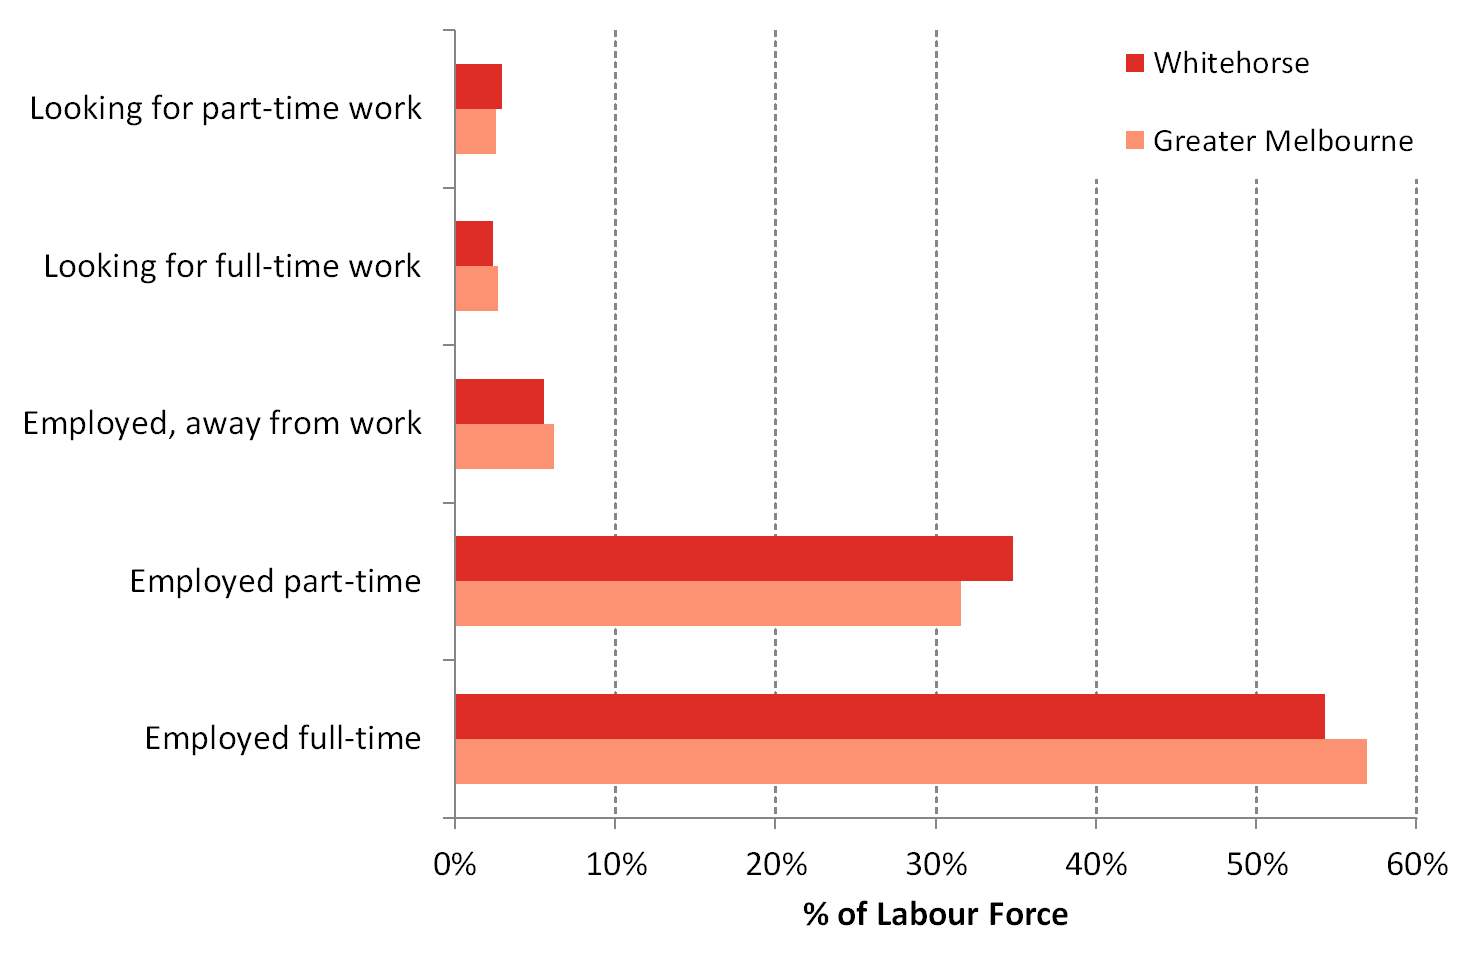
- A total of 61.8 per cent of Whitehorse residents were in the labour force. That is, they were aged 15 years and over and were either employed or looking for work. This is less than for Greater Melbourne at 64.1 per cent. It is likely this is linked with the age structure of the municipality, which includes a larger population aged 60 plus.
- A total of 94.6 per cent of the labour force were either in full or part time employment and 5.4 per cent were unemployed.
- Relative to Greater Melbourne, Whitehorse had a greater proportion of people in part time work and a smaller proportion in full time work.
- Between 2016 and 2021 the number of people in employment in Whitehorse increased by 8,629 persons, with the largest increase in full-time positions (44.5 per cent) and 19 per cent in employed, away from work. The number of people unemployed decreased by 889 across the same period.
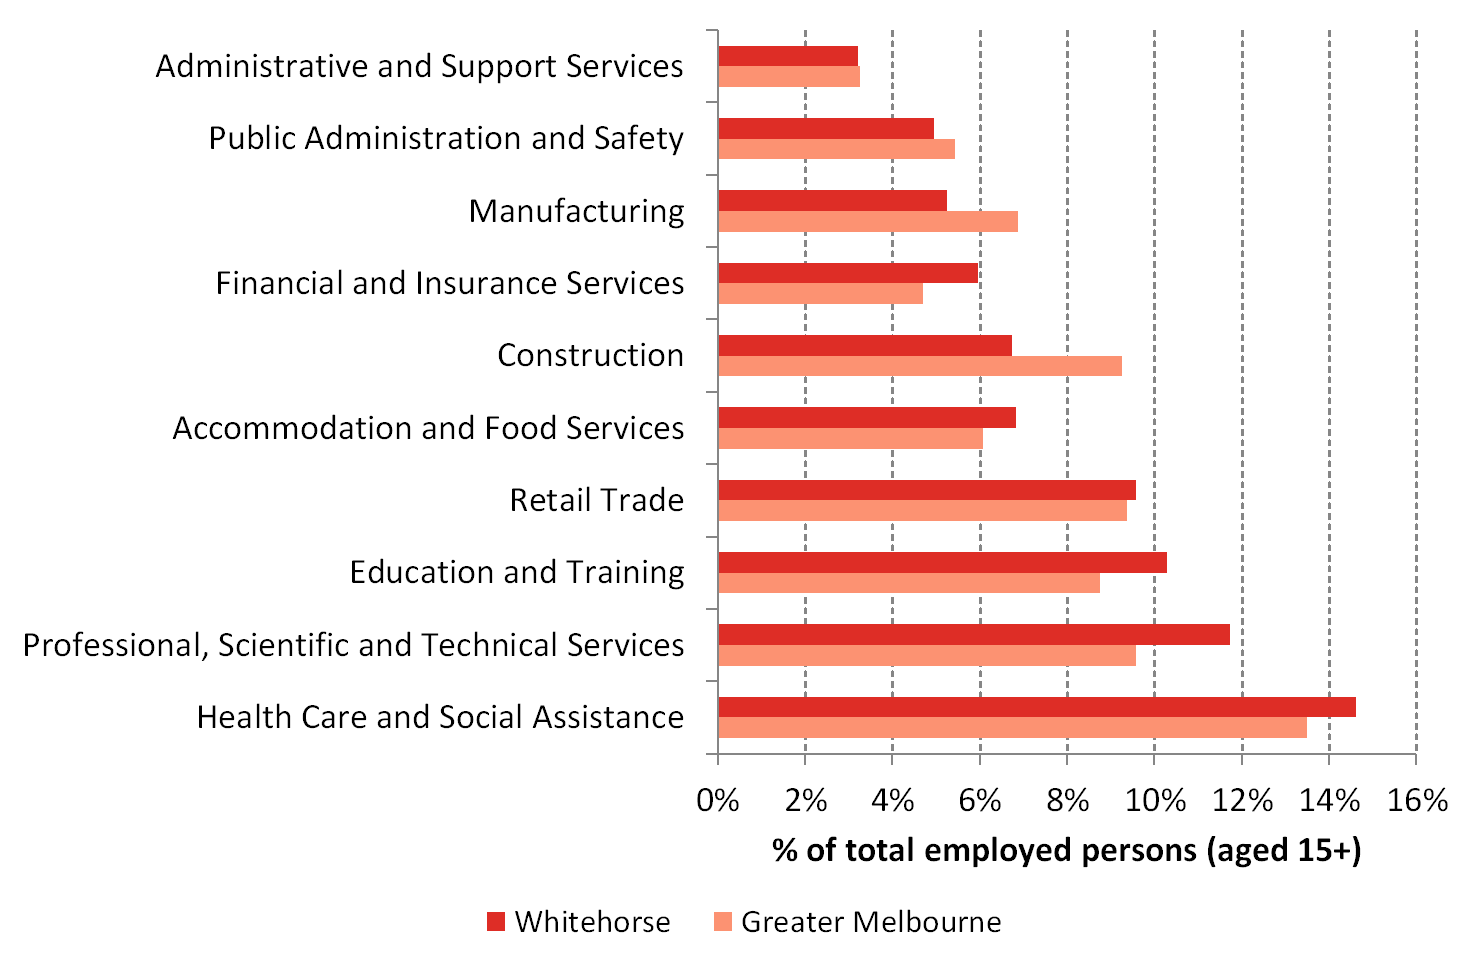
- The most popular industry sectors for the resident population in Whitehorse to work in were:
- Health care and social assistance (12,183 people or 14.6 per cent);
- Professional, scientific and technical services (9,780 people or 11.7 per cent);
- Education and training (8,573 people or 10.3 per cent);
- Retail trade (7,985 people or 9.6 per cent);
- Whitehorse had a smaller proportion of residents working in transport, postal and warehousing compared to Greater Melbourne (3.1 per cent compared to 4.9 per cent), as well as manufacturing (5.3 per cent compared to 6.9 per cent).
Occupation
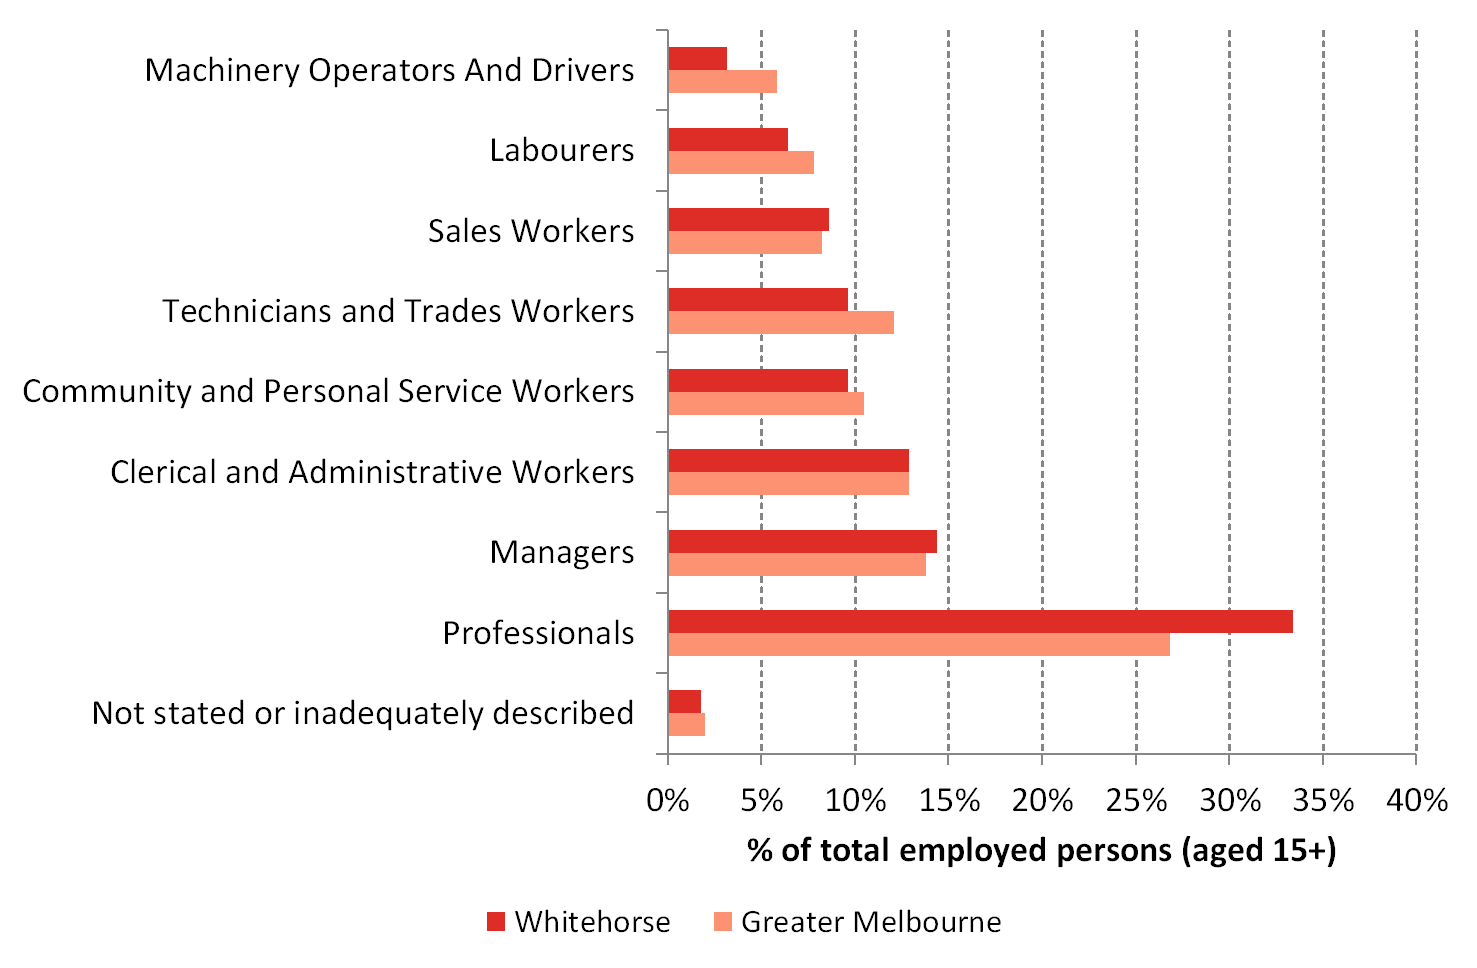
In 2021, the three most popular occupations of Whitehorse residents were:
- Professionals (33.4 per cent);
- Managers (14.4 per cent);
- Clerical and administrative worker (12.9 per cent).
These three occupations accounted for nearly 60 per cent of the employed resident population.
Relative to Greater Melbourne, Whitehorse has a smaller percentage of persons employed as:
- Machinery operators and drivers (3.2 per cent compared to 5.8 per cent);
- Technicians and trades workers (9.7 per cent compared to 12.1 per cent);
- Labourers (6.4 per cent compared to 7.8 per cent).
This is likely to be linked with housing (in)affordability within the municipality.
Location of Employment
In 2021 more than a quarter of residents in Whitehorse worked within the municipality (26.7 per cent) and 69.5 per cent worked outside the municipality. The top five municipalities residents work in outside of Whitehorse are:
- City of Melbourne (19.5 per cent);
- City of Boroondara (7.7 per cent);
- City of Monash (7.4 per cent);
- City of Knox (4.3 per cent); and
- City of Maroondah (3.8 per cent).
Unpaid Work
In 2021:
- A total of 15.5 per cent of the Whitehorse population reported doing some form of voluntary work. This compares with 12.1 per cent for Greater Melbourne.
- Around one in five Whitehorse residents (20.1 per cent) aged 15 years and over did more than 14 hours of unpaid domestic work per week.
- A total of 18,235 Whitehorse residents were providing unpaid assistance (i.e. care) to a person with a disability, long term illness or old age living in the City of Whitehorse. That equates to 12.8 per cent of the population aged 15 plus.
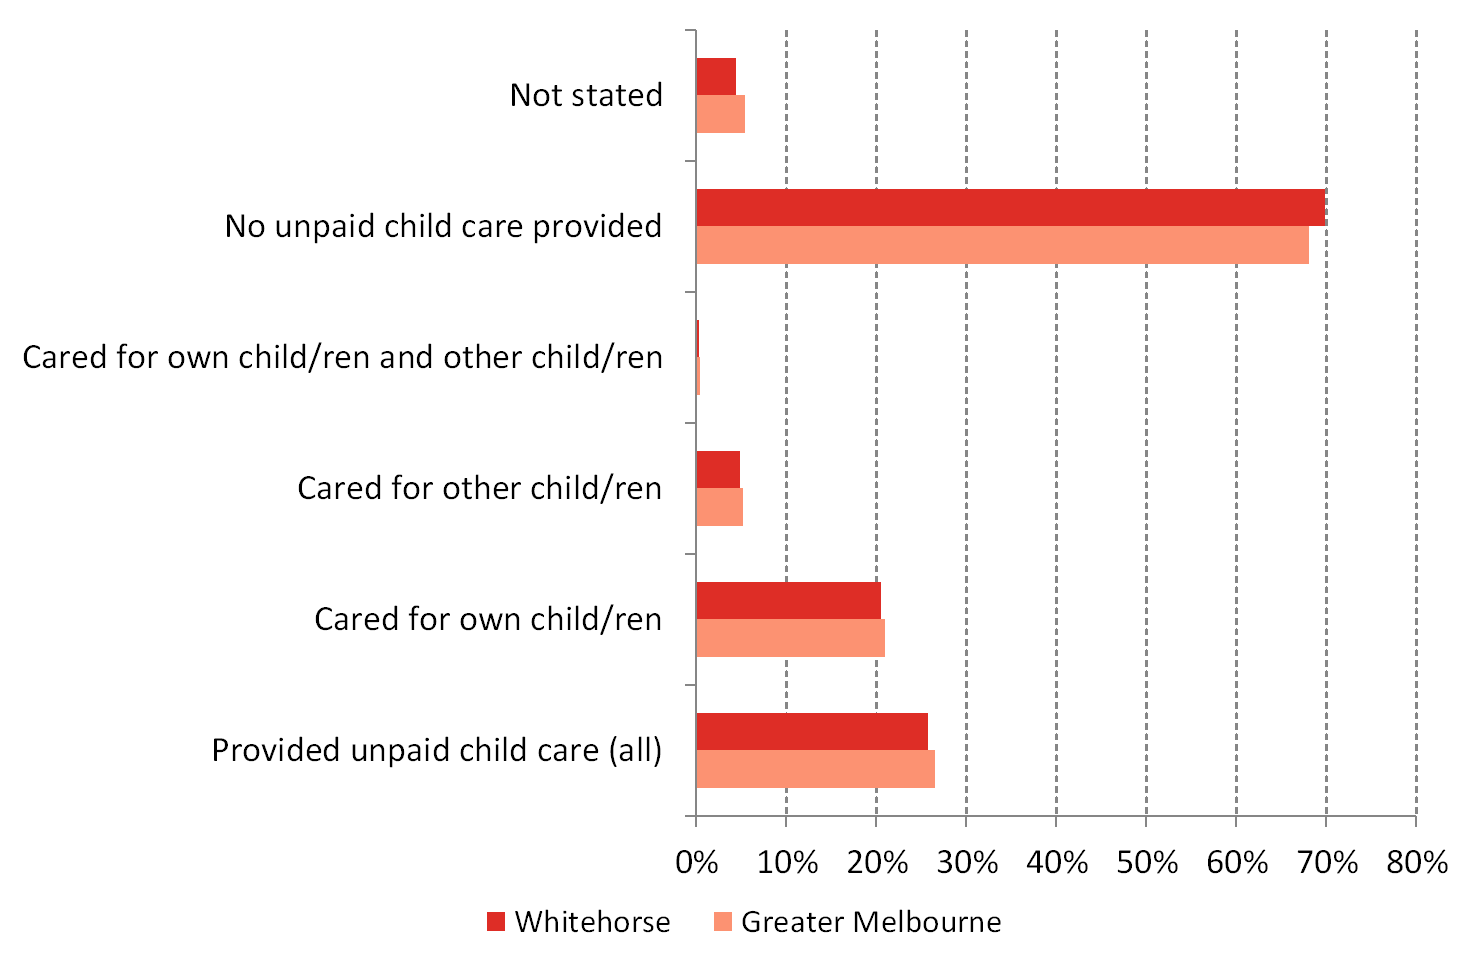
- More than one quarter of the population (25.7 per cent) provided unpaid childcare to either their own children or other people’s children.
Education
In 2021:
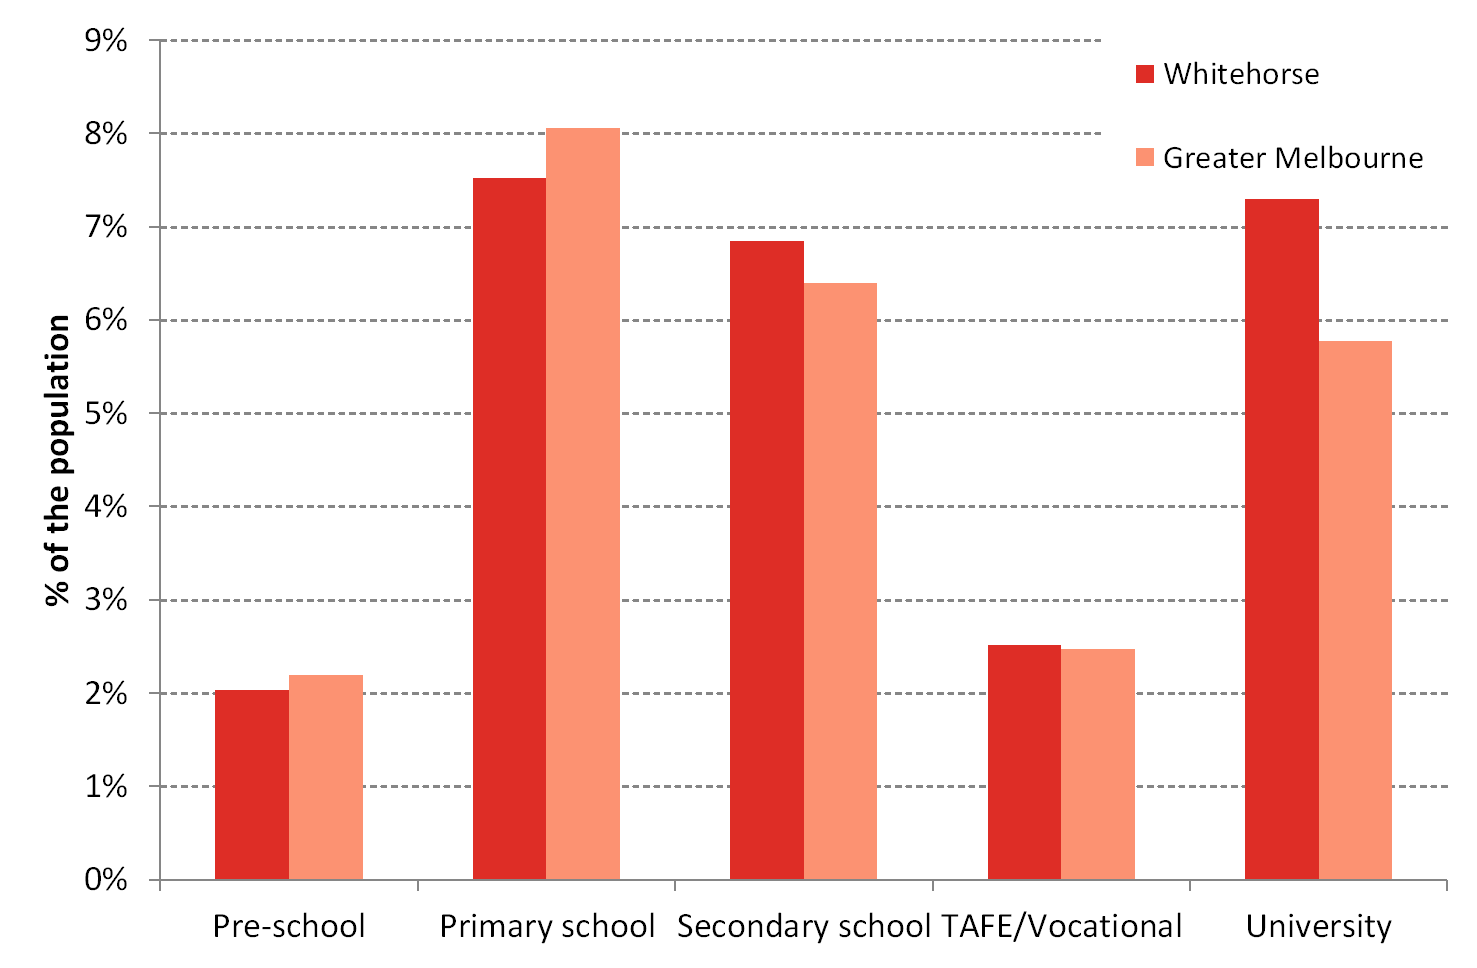
- More than a quarter of Whitehorse residents (27.7 per cent) attended an educational institution.
- Whitehorse had a higher proportion of residents attending University (7.6 per cent) compared to Greater Melbourne (5.8 per cent). It is likely this is linked with Deakin University being located within the municipality (Burwood).
- In 2021, more than four in ten residents (41.7 per cent) had a Bachelor degree or higher. This compares with 32.8 per cent for Greater Melbourne.
Income
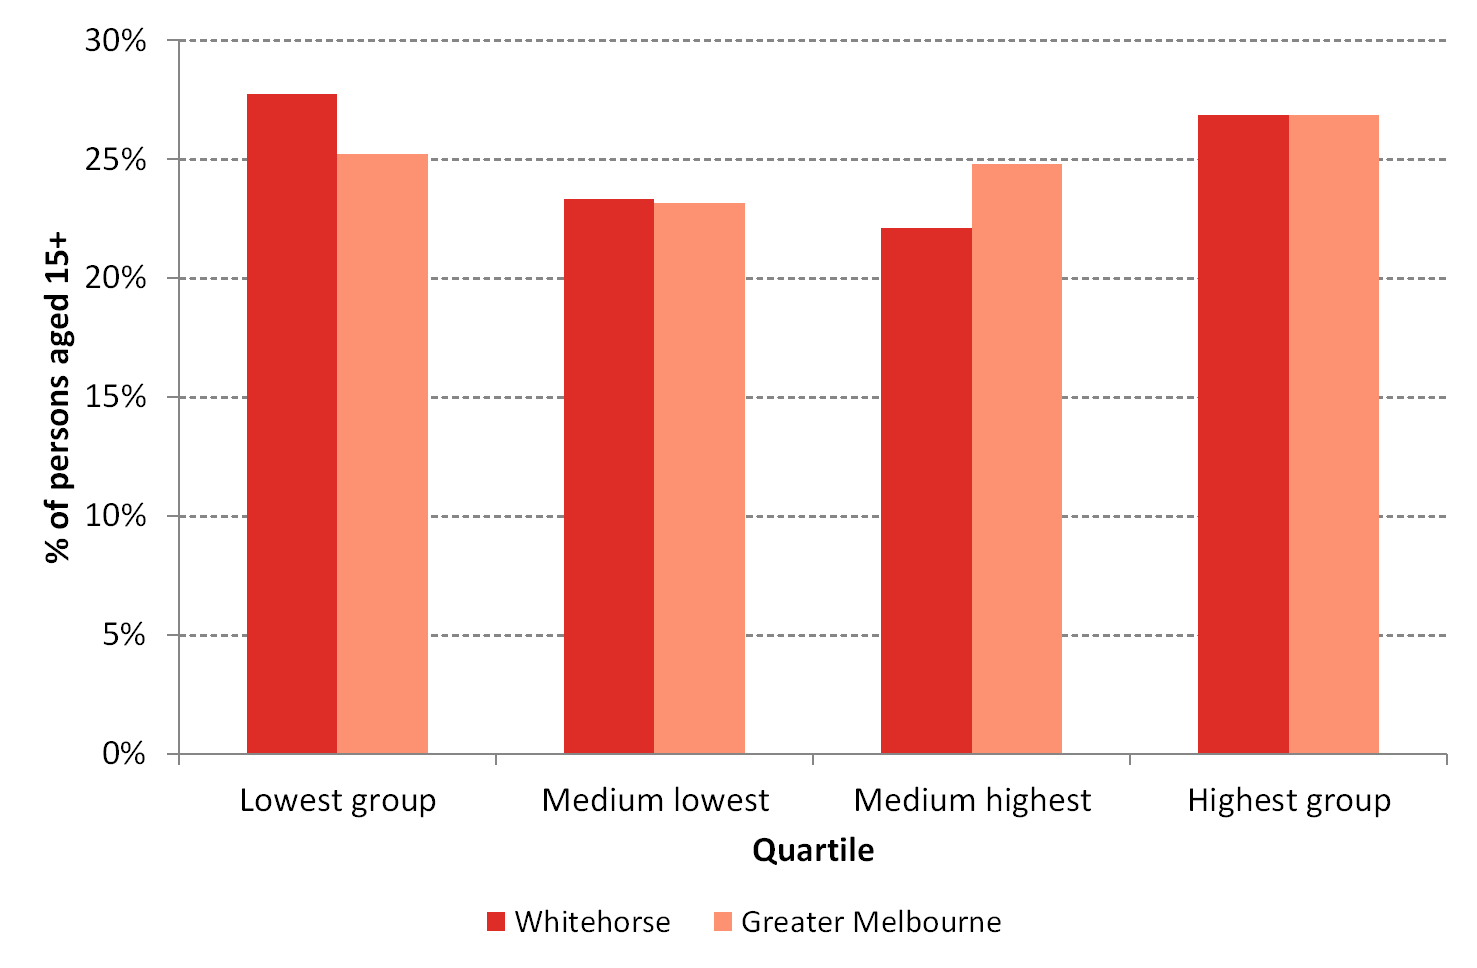
Income quartiles allow for the comparison of relative income-earning capabilities over time. Compared to Greater Melbourne, Whitehorse had a higher proportion of people in the lowest income quartile and a similar portion of persons in the highest income quartile.
Between 2016 and 2021 the biggest growth occurred in the medium lowest income quartile, which showed an increase of 2,727 persons.
In 2021:
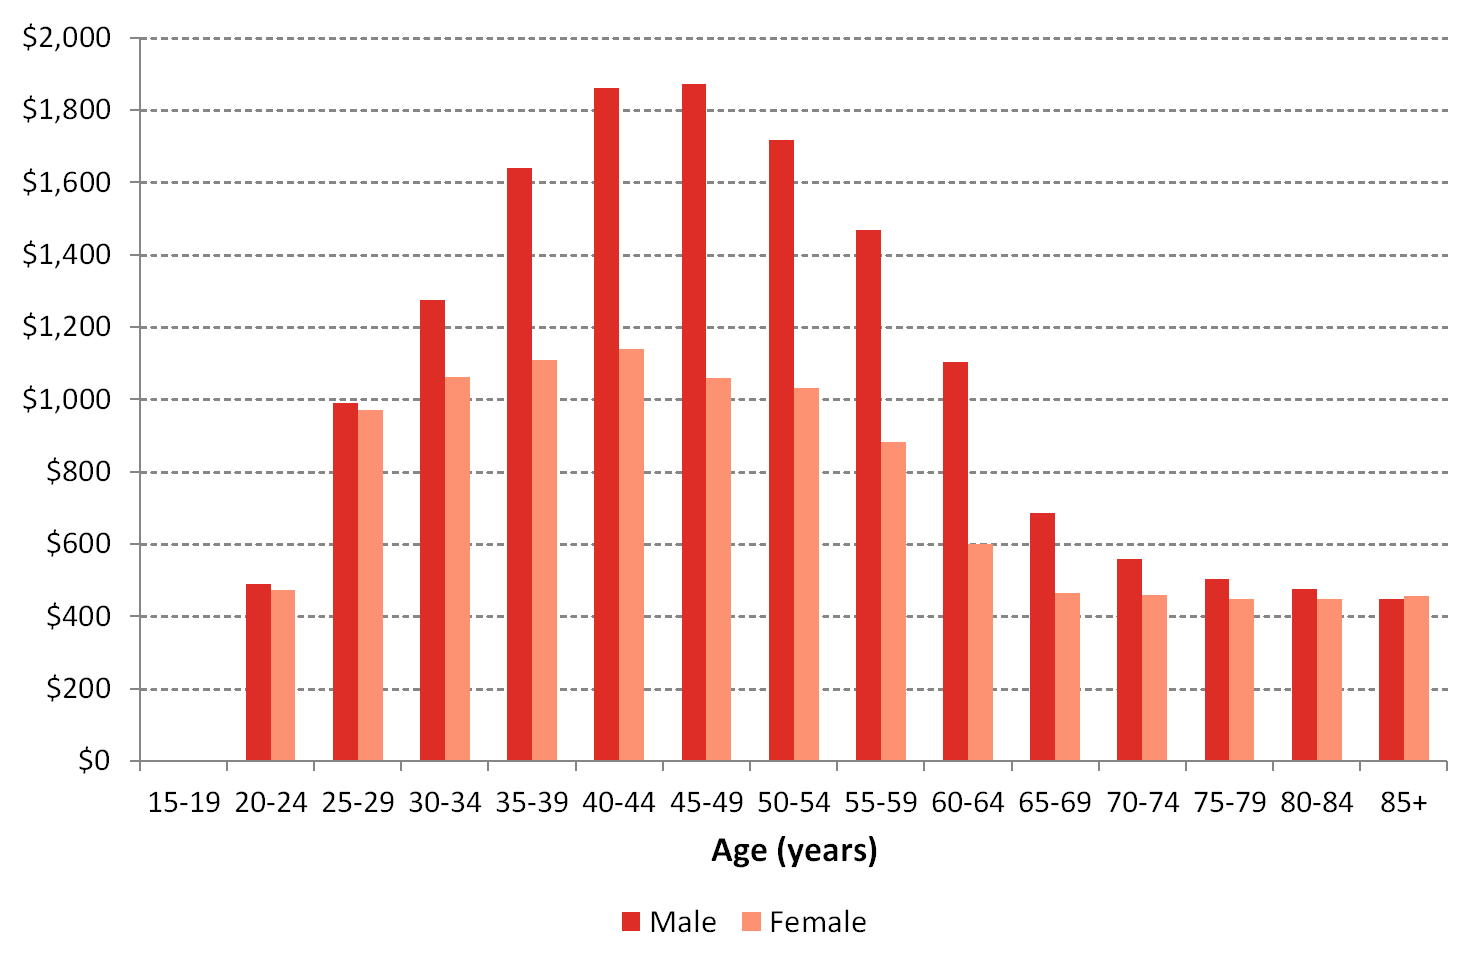
- Females in Whitehorse earned less than their male counterparts across all age groups except 15-19 year olds and 85+ years old.
- The median weekly income for resident males was $958, while the median weekly income for resident females was $648.
- 28.1 per cent of males in Whitehorse were in the highest Victorian income quartile (earning more than $1,696 per week).
- 26.8 per cent of females in Whitehorse were in the highest Victorian income quartile (earning more than $1,242 per week).
- 27.7 per cent of females in Whitehorse were in the lowest Metropolitan Melbourne income quartile (earning less than $336 per week).
Links
For more information about Economics refer to: